Hello my Investors, Traders and Readers friends. After four days on the market formed a congestion area, on Friday, the three major indexes, broke that level and began a journey upward. In these circumstances, an important issue is the determination of the following levels of resistance that must face the stock market. In the following charts I will try to identify the main points for each of the three major indexes.
1.- DJ-30.- On Friday, this index closed at 11,269.02 points, after two consecutive days of increase. The next resistance level is located at 11,500 points, equivalent to the minimum level of March. If the DJ-30 could break this resistance, the next resistance level would be around 11,860 points corresponding to the minimum value for the month of June. I Think it's important to note that with levels of resistance, it is essential to observe the line of SMA50 days. It is very common when the market are down, "bounce" to the line of SMA50 days. Please click on the chart to enlarge.
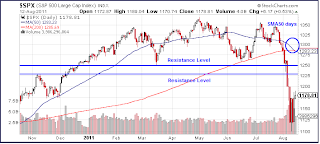
2.- SP-500.- This index closed on Friday at 1,178.81 points. That day, the SP-500 broke a first resistance level, located at 1,173 points, which corresponds to the minimum level in December. The next resistance level is located around 1,227 points to be reached in November. If this index is able to break that level, then would have to face the 1,250 points that correspond to the minimum value in March. Just as in the case of DJ-30, remember the importance of looking at the line of SMA50 days. Please click on the chart to enlarge.
3.- Nasdaq Comp.- This Index closed on Friday at 2,507.98 points. In this case, the next resistance level is located around 2,600 points. This level is the minimum value of June and March and the maximum value in November. That means this resistance level is "very important" for the Nasdaq Comp. In this case, can not forget to see the line of SMA50 days. Please click on the chart to enlarge.


No comments:
Post a Comment