1.-Market's near-term trend, and possibly intermediate trend, is down. Sam Collins, InvestorPlace Chief Technical Analyst
On Tuesday, stocks gapped down on a downgrade of five Spanish regions by Moody’s, followed by earnings misses from3M (NYSE:MMM) and DuPont (NYSE:DD). Commodities were also hit hard with gold futures off 1% and crude oil down 2.3%.
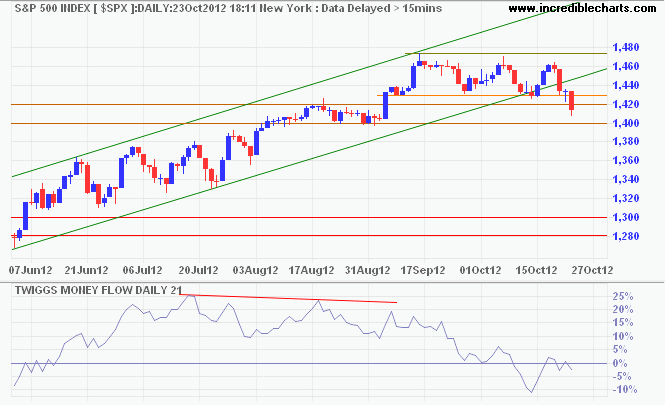
Blue-chip stocks were the focus of Tuesday’s selling, and the Dow Jones Industrial Average showed it by losing 1.82%. The Dow was off 243 points to 13,103, the S&P 500 fell 21 points to 1,413, and the Nasdaq was off 26 points, closing at 2,990. The NYSE traded 669 million shares and the Nasdaq crossed 423 million. Decliners led advancers by 2.7-to-1 on the Big Board and 1.8-to-1 on the Nasdaq.

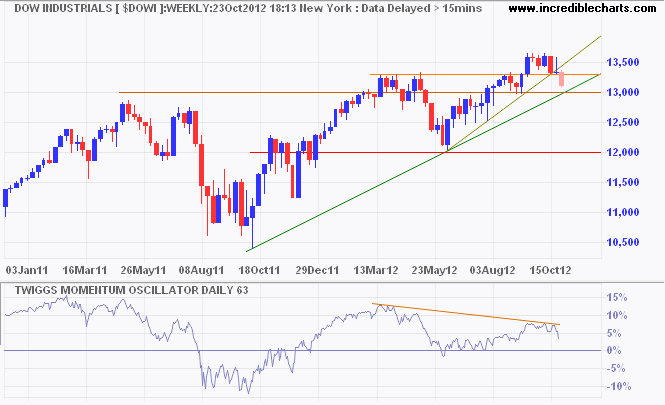
On Tuesday, a broad liquidation of blue chips drove the Dow through support, now resistance, at 13,275, to just above the next support zone at 13,000 to 13,100. This zone is important since just under it is the uptrending 200-day moving average, and a break of that line changes the intermediate trend. The MACD indicator is oversold but not excessively oversold. Blue chips appear to be weak enough to move lower into the next support zone at 13,000 to 13,100.
Even though the blue chips led the September rally, it is the Nasdaq that has consistently been the leader in trend changes. The recent shoulders-head-shoulders (SHS) pattern was first mentioned by the Daily Market Outlook on Oct. 10, and since then, the index has been the market leader. The index has met its downside SHS target, came within 2 points of its 200-day moving average, and bounced from it. Its MACD is oversold and due for a rally.
Conclusion: The better-quality stocks have been trailing the mid- and small-cap stocks lower. The Russell 2000, which is composed of the small-cap segment of U.S. stocks, rallied from 10:30 a.m. Tuesday until the close, and given more time, may have ended with a gain.
Thus, the groups to watch to determine the next move of the broad market may be the small- and midcap stocks. However, near term the overall trend, and possibly the intermediate trend, is down. Therefore, early morning rallies should be used by traders as shorting opportunities until a foundation is laid for a more permanent base of support.
2.- By Colin Twiggs


3.- Where is the Bottom? (From Zacks.com)
"The trend is your friend until proven otherwise."
This sage advice needs to be heeded now so we can put the current pullback in proper perspective. And that is to know that the 3 1/2 year rally is still in place. That is especially true with GDP likely accelerating to +1.9% in the most recent quarter. So we should consider this just a little dip before making new highs.
That begs the question: How low will this dip go?
Previously I thought that 1400 was all that was needed. But now I realize that it's been about five months since we last touched the 200 day moving average. So now seems like a good time to do it again to test investor conviction. That is a healthy process in all bull rallies before pressing higher.
The 200 day rests at 1375. That is where I think we are headed next. And probably will take place before the election. So let's look for a spot under 1400 and relatively close to 1375 to load back up for the next leg higher.
If you've had success navigating these turbulent investment waters the last few years, then congrats. For those with a less than sparkling track record I invite you to see the recommendations in my private portfolio. That's because even if stocks are going down or sideways, there is still a way to make money in the market. Let me show you how.


No comments:
Post a Comment