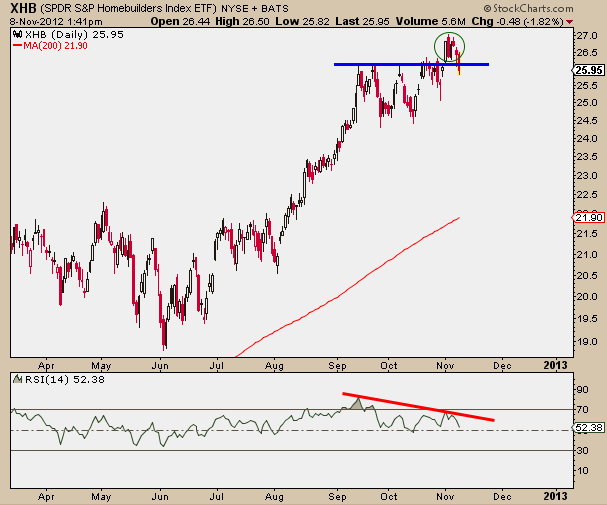
J.C. Parets at All Star Charts sees a false breakout in the XHB chart. “From false moves come fast moves in the opposite direction. In this case, we’re talking about the November 1st false breakout above key resistance that could not hold for more than a week,” he writes.
Homebuilder ETFs may be overvalued after their strong run in 2012. For example, Paul Weisbruch at Street One says the builder funds are among the ETFs with the highest price-to-earnings ratios, a valuation measure.
In the options market, some traders have been using puts on the builder ETFs to hedge gains or position for a pullback in the high-flying funds. [ETF Chart of the Day: Home Construction]
Additionally, Parets says momentum in the homebuilder ETFs is “rolling over” in a so-called bearish divergence.
“All in all, I would be very careful here on the long side for homebuilders,” he says.[Homebuilder ETFs Try Another Breakout After Housing Data]
SPDR S&P Homebuilders
Chart source: All Star Charts.
The opinions and forecasts expressed herein are solely those of John Spence, and may not actually come to pass. Information on this site should not be used or construed as an offer to sell, a solicitation of an offer to buy, or a recommendation for any product. ...

No comments:
Post a Comment