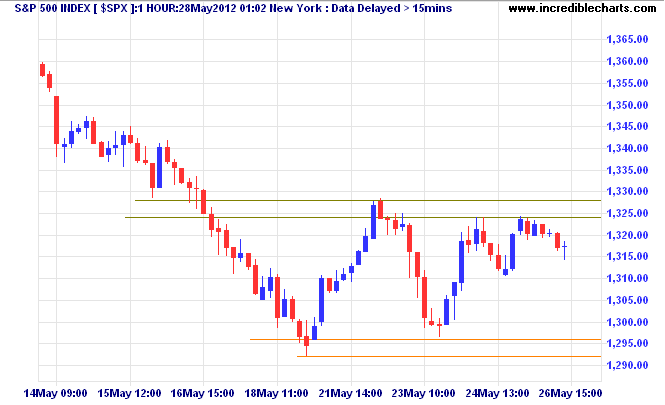
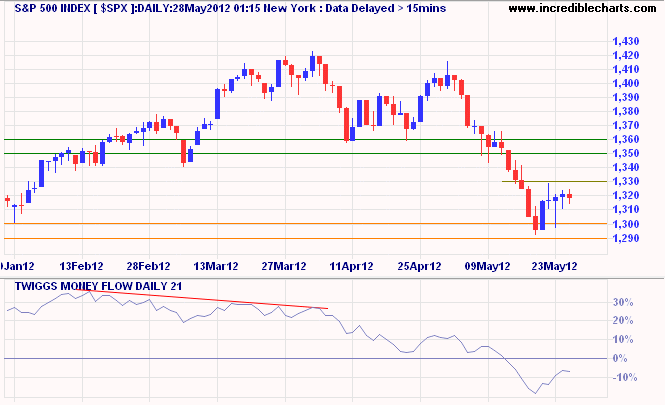
The S&P 500 finished the week having twice respected support at the 50% Fibonacci retracement level of 1292/1296 on the hourly chart. Recovery above resistance at 1330 would indicate the end of the secondary correction.
By Colin Twiggs

21-Day Twiggs Money Flow below zero, however, continues to warn of selling
pressure. Reversal below 1290 remains likely and would test primary support at
1150.

No comments:
Post a Comment