* Target calculation: 78 – ( 81 – 78 ) = 75
Still on the daily chart, spot gold found short-term support at 1700, penetrating the descending trendline. A stronger dollar would suggest further gold weakness but the $DXY primary trend remains down. Expect another test of $1700 but respect would signal a rally to $1800 per ounce*. A 63-day Twiggs Momentum trough above zero would signal a primary up-trend, while breakout above $1800 would confirm.

* Target calculation: 1650 + ( 1650 – 1500 ) = 1800
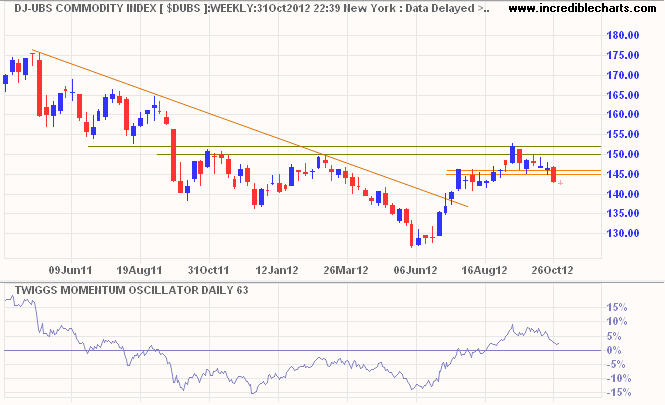
The DJ-UBS Commodity Index (weekly chart) reflects an easing inflation outlook, breach of medium-term support at 145 signaling a correction. A 63-day Twiggs Momentum trough above zero would suggest a primary up-trend, while a fall below zero would mean further weakness.

Brent Crude (weekly chart) is testing support at $108 per barrel. Breakout would indicate a decline to $100. Reversal of 63-day Twiggs Momentum below zero would strengthen the bear signal.

* Target calculation: 108 – ( 117 – 108 ) = 99
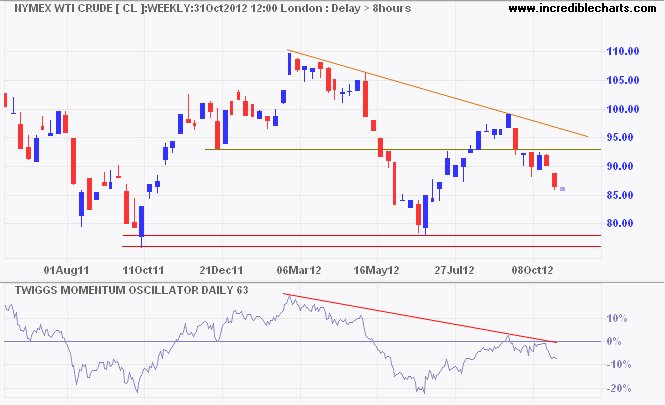
Nymex WTI Light Crude is falling faster, headed for a test of primary support at $76/$78 per barrel. A 63-day Twiggs Momentum peak below zero warns of a primary down-trend.


No comments:
Post a Comment