 |
| Gold Feet (Photo credit: @Doug88888) |
15th)
We begin the week with the board in a sea of red as Currencies and Commodities continue to deal with last weeks ECB meeting. While the initial Interest Rate Decision to leave rates unchanged had little effect on any major market, the language used by Mario Draghi after the fact resulted in decent profit taking in the Euro Futures. In short, he noted the three month rally in the Euro and stated that it could prompt him to revise the inflation projection for next month.
While no major support or resistance levels were violated right away, the drop in the Euro did lead to adjustments in quite a few markets ahead of this weeks lighter liquidity trading. With the Chinese markets closed in recognition of the Lunar New Year, we expect trading volumes to be thin. And without any major announcements until the upcoming G20 Summit at the end of the week, the plan will be to remain patient and look for any violations of key levels on the charts to trade.
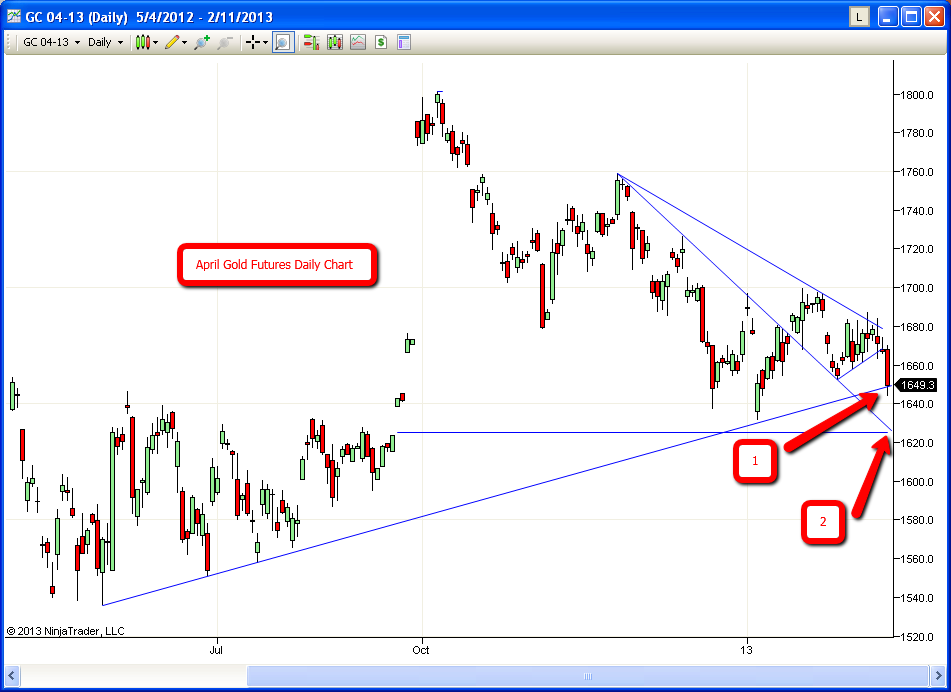
The April Gold has already fallen almost $20 an ounce as we near the open of the pit traded session but seems to have targeted the same support trendline that has been used four times since the Summer low (arrow #1). It should come as no surprise that the early selloff would run into a snag around this low as there were surely resting buy orders waiting to catch the down move at a low price. If this support level is violated, there is another standout price for support that has my attention, and that is $1625 (Arrow #2). There are a few reasons that this price will be in focus. The first reason is because a drop to this level will mean that Gold Futures had successfully filled all gaps on the chart from the breakout rally in August. If you look carefully at the prior gaps on the chart, you will notice that the futures used these levels as support before bidding up fifty dollars or more. Secondly, if the market were to fill this last gap around $1625, it will likely trigger sell-stop orders of those trying to buy off of the lows of January 4th with tight stops. Lastly, this level also pinpoints the convergence of two major chart trendlines, which technicians will likely use as targets for a reversal.
In short, while the Gold starts the week with a case of “The Mondays”, the daily chart is still providing fairly solid targets for traders. The strategies that I continue to recommend are all based on technical levels provided by the daily and intraday charts. My long term bias remains bullish, but while price action remains choppy, recommendations on new positions will continue to have a day or swing-trade setup.

No comments:
Post a Comment