| Jim Robinson (Neighbours) (Photo credit: Wikipedia) |
New York, Mar.30, best stock to buy .- We've asked our friend Jim Robinson of profittrading.com to provide his expert analysis of charts to our readers. Each week he'll be be analyzing a different chart using the Trade Triangles and his experience. Today he is going to take a look at the technical picture of Mellanox Technologies, Ltd. (MLNX).
I hope you are having a GREAT week !
This week let's take a look at MLNX which is a very interesting chart right now.
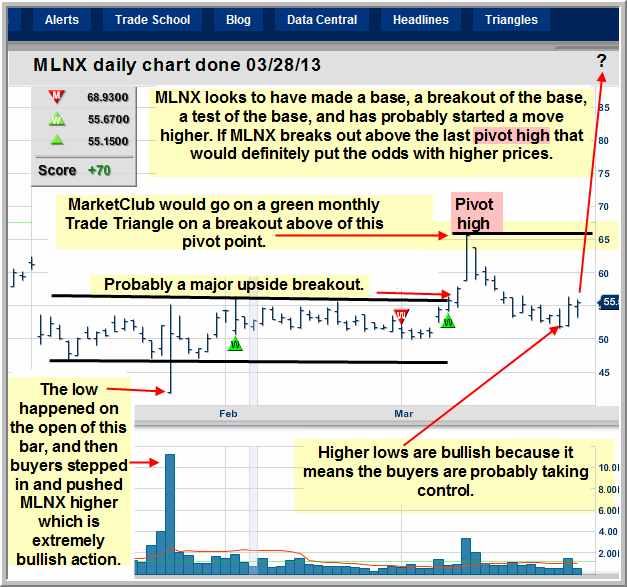
MLNX looks to have made a base, the breakout of the base, a test of the base, and has probably already started the next bull swing higher, which has the possibility of being a big move.
I hate to sound like a broken record, but I keep mentioning that MarketClub will often put in green Trade Triangles just as markets are breaking out to the upside of chart pattern pivot points.
If MLNX does trade higher, this will probably be another example of that, as MarketClub will go on a green monthly Trade Triangle right as MLNX is taking out the last pivot high.
Another interesting thing on this chart is how the low came in right on the open of a big gap down, in which the buyers pushed the stock up off the low on high volume.
That means that there was strong demand for the stock at that price and that was probably a major low for MLNX, which is another reason to think MLNX will continue higher from here.
Like I always like to point out, there are no sure things, but with that being said, MLNX looks to be possibly on the verge of a huge move higher from here, which of course, makes this a Chart to Watch !!!


No comments:
Post a Comment