| Triangle I (Photo credit: Matt Carman) |
New York, Jun.2, stock trade .- We've asked our friend Jim Robinson of profittrading.com to provide his expert analysis of charts to our readers. Each week he'll be be analyzing a different chart using the Trade Triangles and his experience. Today he is going to take a look at the technical picture of the Cisco Systems, Inc. (CSCO).
I hope you are having a GREAT week !!!
This week I have, what looks to be, a Hot Stock Chart for you !!
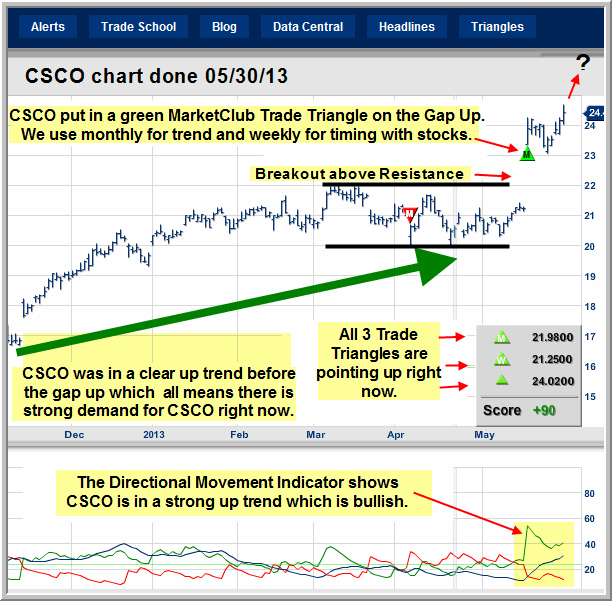
CSCO was in a strong up trend, started consolidating, and then made a big gap up, which means supply over took demand in a big way which is bullish.
CSCO was on a daily and weekly green Trade Triangle before the gap up (daily and weekly Trade Triangles not shown on chart) and put in a monthly MarketClub Trade Triangle on the gap up which is more bullish action.
With stocks we use the monthly Trade Triangle for trend and the weekly Trade Triangle for timing.
The Directional Movement Indicator shows that CSCO is in a strong up trend which fits right in with what the MarketClub Trade Triangles are saying.
If you are looking for a stock with great upside potential, I think CSCO is definitely a Chart to Watch.


No comments:
Post a Comment