"No man can become rich without himself enriching others"
Andrew Carnegie


Showing posts with label stocks to watch. Show all posts

Thursday, September 26, 2013

Believe It or Not, the Bulls Still Have Plenty of Muscle

An einem Sonntag im August...
(Photo credit: Concentrated Passion)
Russell, NYSE Composite still pushing upward


Chart Key
The Russell 2000 made a new all-time high yesterday with its intraday high of 1,082. The Russell 2000 — like its cousin, the Nasdaq (see Wednesday’s chart and comment) — is trading within a bull channel, but unlike the Nasdaq, it has no resistance above it to hamper further new highs. MACD is slightly overbought but could become more overbought as the index continues its dogged advance.
The NYSE Composite is a broad-based index containing all stocks traded on the Big Board. Its chart pattern is much like that of the S&P 500 (see Monday’s chart), which recently made a new all-time high. But the NYSE’s new high at 9,906 — made last Wednesday — was unlike the S&P 500 in that it has not seen a new high since May, and its all-time high at 10,387 was made in October 2007.
Conclusion: Despite yet another down day, the short-, intermediate- and long-term trends still are bullish. The continuing power of the bull market is supported by both the broad-based indices as well as the small- and midcap stocks. The ability to keep trudging along despite the overwhelming negativity coming from Washington is a powerful argument in favor of the bulls. Bearish momentum is absent.
The strongest sectors continue to be industrials, tech & biotech, consumer discretionary, biotech, pharma, housing, materials and financials. Bonds and bond substitutes have been the weakest.
Enhanced by Zemanta

Dollar and Treasuries likely to lift Gold

English: A sample of crude oil from Haenigsen,...
English: A sample of crude oil from Haenigsen, Germany. Deutsch: Flasche mit Erdöl (Photo credit: Wikipedia)
By Colin Twiggs

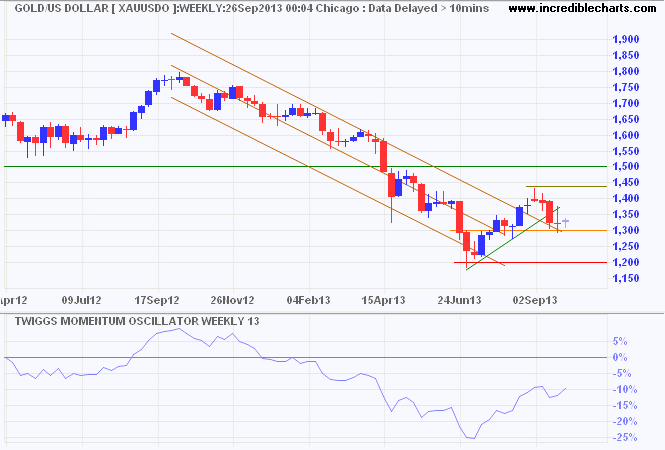
Sydney, Sept.26, stock watch .- Spot gold continues to test support at $1300/ounce. Failure of support would visit the primary level at $1200/ounce, while respect would test $1440. Breach of the downward trend channel indicates the primary trend is slowing, but recovery above $1440, and a primary up-trend, seem some way off — as does recovery of 13-week Twiggs Momentum above zero.

Spot Gold
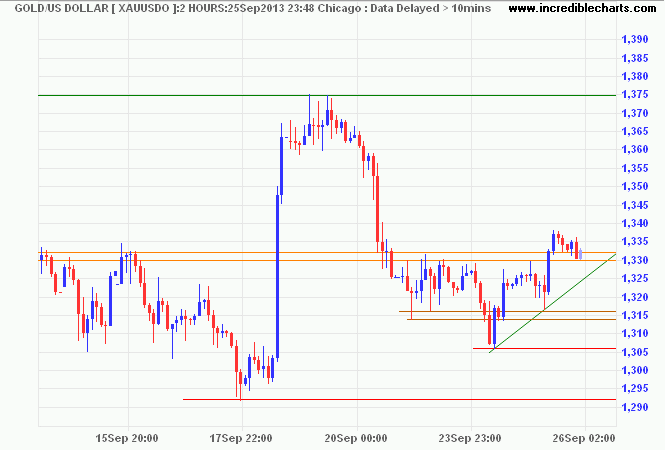
The two-hourly chart shows breakout above resistance at $1330. Retracement that respects the new support level would signal a rally to test $1375, improving the chances of a bottom.
Spot Gold

Dollar Index

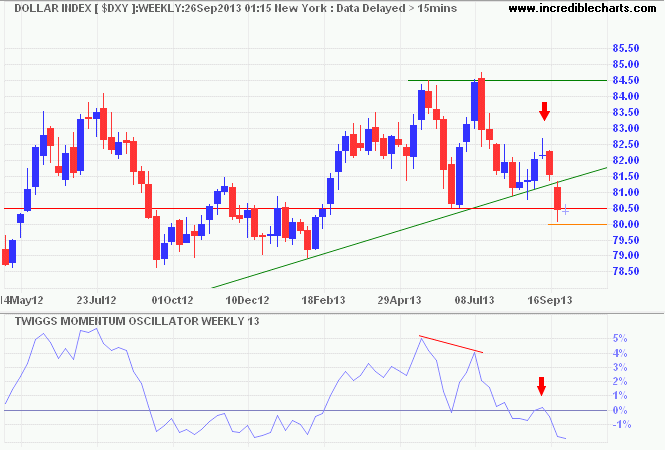
The Dollar Index broke primary support at 80.50, warning of a primary down-trend. Follow-through below 80 would confirm. A 13-week Twiggs Momentum peak at zero also suggests a down-trend. A falling dollar would boost gold prices. Recovery above 81 is unlikely, but would warn of a bear trap.
Dollar Index
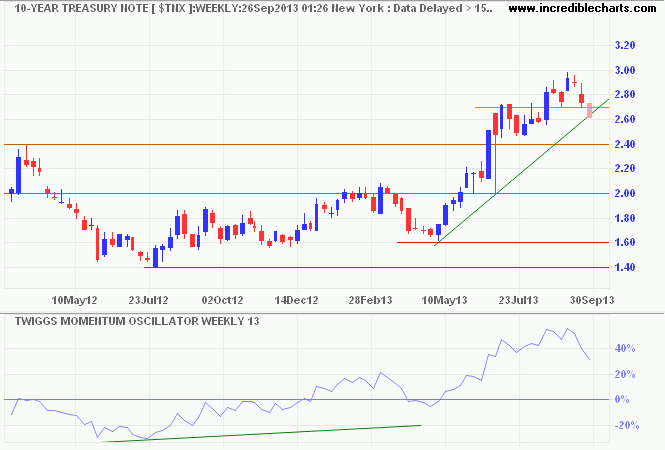
The yield on ten-year Treasury Notes broke support at 2.70 percent, warning of another test of 2.40 percent. Penetration of the rising trendline would strengthen the signal. Falling treasury yields are also likely to lift precious metal prices (because of the lower opportunity cost).
10-Year Treasury Yields

Crude Oil

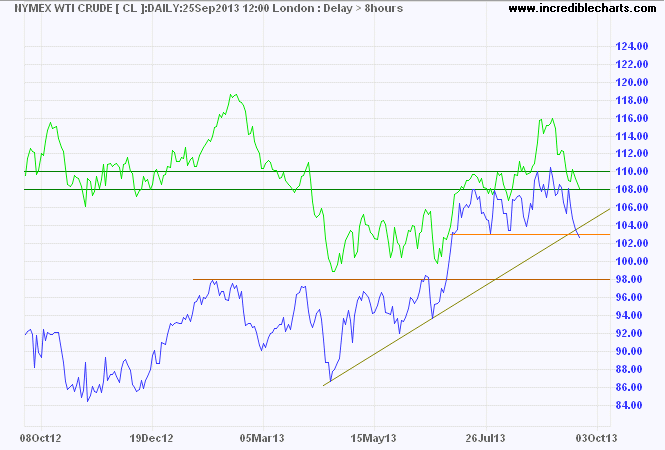
Nymex light crude broke support at $103/barrel and its rising trendline, warning that the up-trend is slowing. A test of medium-term support at $98/barrel is now likely. The wider spread with Brent Crude is an indication of tensions over Syria which threaten supply.
Brent Crude and Nymex Crude

Commodities

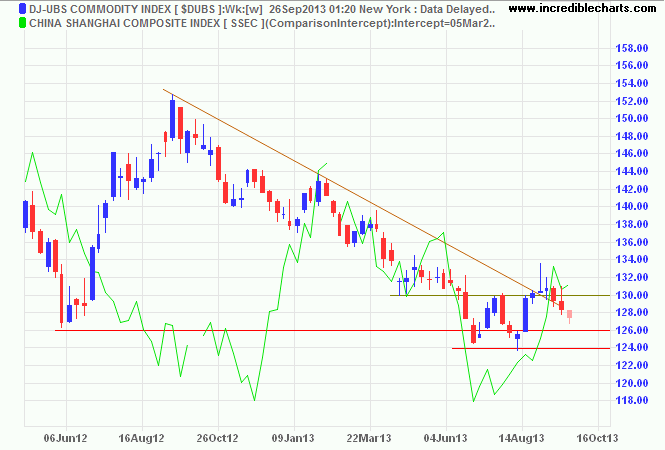
Commodity prices continue to fall, with the Dow Jones-UBS Commodity Index headed for another test of 124 despite a resilient Shanghai Composite Index. Recovery above 130 is unlikely, but would confirm the earlier double-bottom reversal and a primary up-trend.
Dow Jones UBS Commodities Index
* Target calculation: 130 + ( 130 - 125 ) = 135 ...
Enhanced by Zemanta

Top 10 Stocks For 2014

EI-EPD
EI-EPD (Photo credit: markyharky)
By StreetAuthority

Chicago, Sept.26, stock trade .- It's one of our most popular pieces of annual research. Literally hundreds of thousands of investors have read -- and profited -- from this advice.

And since we first started publishing our annual Top 10 Stocks list, we've beaten the market seven out of 10 years. For comparison, shares of Warren Buffett's Berkshire Hathaway (NYSE: BRK-B) have only beaten the market five out of the past 10 years.

I've shared one of these stocks with you already. Last week, I told you about Philip Morris International (NYSE: PM). This tobacco company, while hated by most people, has raised its dividend nearly 85% since spinning off from its parent company in 2008.

And in today's article I'll tell you about another one of my "Top 10 Stocks for 2014."

But before I continue, I want to make something clear. I can't provide you with all 10 of my "Top 10 Stocks for 2014" here. I've reserved the report exclusively for my Top 10 Stocks advisory subscribers. It wouldn't be fair to them to give this list away to everyone.

But I can give you something even more valuable than just a couple of stock picks...

You see, I want to show you why these stocks made my list for 2014... and how you can find similar stocks on your own.

I think my 2014 ideas may end up being the most profitable in our history. As you can see in my chart, this group of 10 stocks has already beaten the S&P during each of the past five years -- that includes the sharp bear market we saw in 2008 and the powerful bull market we enjoyed in 2009 and 2010.


In fact, if you had invested $10,000 into this group of stocks just five years ago, your investment would be worth $22,950 as of the end of September -- a 129.5% total return. The same investment in the S&P would be worth just $14,590 -- a 45.9% return.

So what's the secret behind this performance?

Well, after years of research, I've found that companies with a few basic characteristics are the ones that consistently beat the S&P...

-- Companies that enjoy huge (and lasting) advantages over the competition.

-- Companies that are buying back massive amounts of their own stock.

-- Companies that pay investors each and every year by dishing out growing dividends.


I've found that more often than not, companies that match these three simple criteria are the ones that make you the most money long term.

It makes sense -- strong companies that take care of their shareholders tend to do better over the long run. These are the stocks that consistently create value for their investors year after year, delivering some of the market's biggest returns.

Take Enterprise Products Partners (NYSE: EPD), for example. EPD made my "Top 10 Stocks for 2014" list precisely because it meets two out of the three characteristics listed above.

Does EPD enjoy huge advantages over its competition? Absolutely.

The company is one of the largest pipeline companies in the U.S., with 50,000 miles of onshore and offshore pipelines.

Does it pay a steadily growing dividend? You bet.

Since 1998 EPD has raised its dividend 202%... from $0.225 per share every quarter to $0.68.

It doesn't take a Ph.D. to understand that this is the sort of stock that should continue to make money for its investors year after year.

And in recent years, EPD has done just that. Since 2008, shares have returned roughly 170%. That includes a nearly 20% gain since the start of the year.

Performance like this proves investing doesn't have to be complicated. There's nothing complex about investing in simple businesses that dominate their industries and return billions of dollars to their investors through dividends and buybacks. Yet it works.

Keep this in mind. It might be the most profitable investing lesson you'll ever learn.

Note: For more information about the rest of my Top 10 Stocks For 2014 --including several names and ticker symbols -- you can follow this link.

Enhanced by Zemanta

Tuesday, August 20, 2013

Gold Chart of The Week

By INO
Chicago, Aug.20, stocks to watch .- Each Week Longleaftrading.com will be providing us a chart of the week as analyzed by a member of their team. We hope that you enjoy and learn from this new feature.
Weekly Gold Report (August 19th through August 23rd)
Market bulls were dealt a blow last week as stock traders began booking profit on long positions in expectation of a FED taper in their bond purchase program. The selling pushed the stock indexes lower throughout the week until the Dow suffered its largest weekly drop in over a year. Similarly, the US Bond Markets fell under pressure as traders continued to try to anticipate the FED’s next decision regarding Quantitative Easing and Interest Rates.
While the upcoming week is short on economic data from the United States, traders will be looking forward to PMI figures from China and Germany. We will also have an opportunity to review the minutes from the last FOMC Meeting, which should provide decent market movement. Lastly, we will hear from a few FED Members later in the week as they convene for their annual Jackson Hole Symposium.
I anticipate the FED speak will be nothing short of confusing, which has been par for the course over the last several months. When one member is hawkish today, another member is dovish the following day. It makes sense to perpetuate this style of reporting because if every FED member agreed on the scale and timeline of QE, the major financial markets would experience massive directional moves, and a one sided trade. And until the FED actually feels comfortable enough to raise Interest Rates, we should expect this type of reporting and inconsistent FED speak.
The Precious Metals markets seemed to benefit the most from the profit taking selloff from last week. Gold was up 4.60% on the week and Silver was up significantly more. It was obvious that Hedge Funds added to their net long positions in both Precious Metals and speculators also seemed to be along for the rally. It will be interesting to see if the rally continues into this week’s Precious Metals trade. I will be watching the stock markets as my indicator for Metals. If stocks continue to feel pressure this week, I would have to assume that the profit from stocks will continue to spill over into the Metals. If the stocks begin to see some relief from last weeks drop, then I would assume Gold and Silver will consolidate and possibly retrace some of the rally from the prior week.

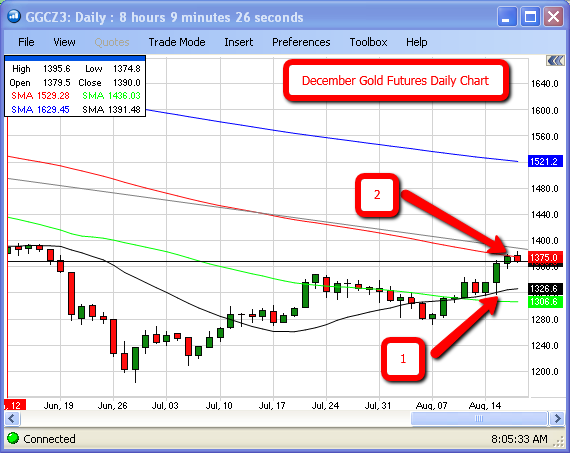
Gold Futures in the December contract are holding between the 20day and 100day simple moving averages (arrows #1 and #2). Until we hear from the FED members later in the week, I would not be surprised to see Gold Futures continue to consolidate between $1325 and $1375. With the light volume in markets across the board, it is easier for large funds to drive markets with large lot orders, so traders should always be prepared for volatility. But I doubt we will see much until the FED minutes are released later in the week.
Enhanced by Zemanta

Thursday, August 15, 2013

What Do You See in This Chart?

New York Stock Exchange
New York Stock Exchange (Photo credit: Mike_fleming)
The bulls see a cup-and-handle formation while the bears see a head-and-shoulders


The Dow Jones Transportation Average fell 0.81%, with 18 of its 20 stocks posting losses. And the Dow industrials fell 0.73% as two economic reports appeared to have a negative impact on stocks. The weekly MBA Mortgage Index fell 4.7%, its 12th decline in the past 14 reports, and July PPI was unchanged while core PPI ticked up by 0.1% where analysts were looking for better results.
At the close, the Dow Jones Industrial Average was off 113 points to 15,338, the S&P 500 fell 9 points to 1,685, and the Nasdaq lost 15 points at 3,669. On the NYSE, decliners outpaced advancers by 1.8-to-1, and on the Nasdaq, decliners were ahead by 1.4-to-1. Volume was light with the Big Board trading 622 million shares and the Nasdaq crossing just 374 million shares.

Chart Key
The S&P 500 chart illustrates the dilemma of this summer’s traders. Some chartists see a cup-and-handle formation in the above chart. This would be a bullish signal with the implication of a broad market breakout with a target of 1,775.
Others see the opposite — a head-and-shoulders top forming with the neckline at 1,676 and a downside target of 1,644.
It’s best not to anticipate either theory, but rather let Mr. Market tell you of his next move.
Conclusion: In the short term, you may be a bull or a bear — there is plenty of evidence on both sides. I’m more in the bear camp short term for reasons I’ve stated ad nauseam for the past week. But all should agree that the long-term trend is still strongly bullish and that a sell-off would be a great opportunity to load up on stocks that will return many-fold over the years. ...
Enhanced by Zemanta

Why You’re a Terrible Market Timer

Investor-Relations-auf-Facebook
 (Photo credit: koesteran)
By Rude Awakening

Baltimore, Aug.15, stock trade .- You're not an effective market timer. Don't beat yourself up over your shortcomings. After all, most retail investors buy when they should be selling. Then, when the market turns against them, they sell out right at the bottom. You're in good company…


Main Street investors have a bad track record because they allow their emotions to get the best of them. They're more susceptible to fear and greed. They simply overlook the dangers of running with the herd and following their gut.

So at first glance, the fact that more retail investors are taking an interest in stocks might be cause for concern…

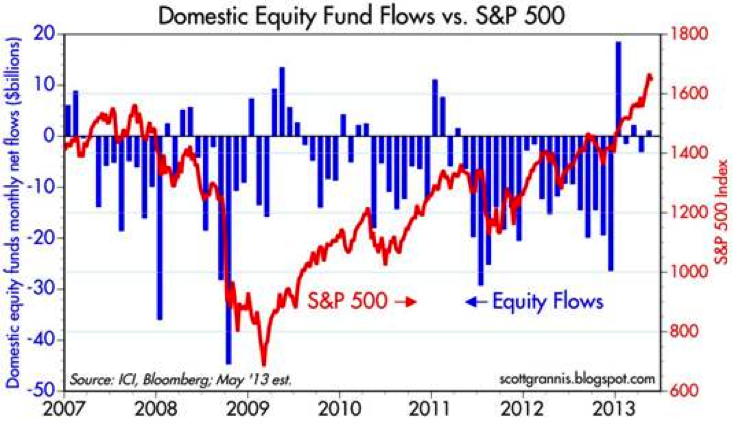
"According to the Investment Company Institute, the Great American Public has poured $92 billion into the stock market via stock mutual funds since the start of the year," reports MarketWatch.

"To put that in context, in the first seven months of last year — when the market was much lower — they withdrew $180 billion…

"The last time the investing public jumped into the Wall Street pool with both feet like this was in 2007. And they are investing even more this time around. In the first seven months of 2007 they invested $85 billion into stock funds."

So is it time to sell out and head for the hills?

Not quite…

Yes, the market has generated some newfound interest from retail investors so far this year. That's not surprising at all. Investors are going to take notice when the broad market is up double-digits midway through the summer.

However, we still have a long way to go before we make up for the record outflows that occurred from 2009-2012:


The truth is investors have been on the run from stocks since the financial crisis. The market's definitely attracting some new money this year—but it's not a climax of years of mom and pop investors piling into a red-hot market.

It wouldn't surprise me if all of these new investors are forced to endure a small correction sometime over the next several months. Shaking out some of the weak hands is fine with me. However, as I explained yesterday, I doubt the market will hit the reset button again at this stage of the game…

The trend continues to tell you that consolidation periods and corrections are buying opportunities. Until this message changes, you should feel comfortable seeking out new investments.
.
Enhanced by Zemanta

Thursday, August 8, 2013

The Safety Net: Why You Shouldn’t Worry About Earnings

omega
omega (Photo credit: davedehetre)
By Welthy Retirement

Palo Alto, Aug.8, stocks to watch .- In October 2011, I recommended Omega Healthcare Investors Inc (NYSE: OHI) in my former newsletter, The Ultimate Income Letter. The stock remains in The Oxford Club’s Perpetual Income Portfolio (which I am no longer personally tracking). Since it was first recommended, it has returned 86%. During the same period, the S&P 500 has returned 40%.
For the past few weeks, several readers of The Safety Net have requested I take a look at the dividend safety of Omega Healthcare, which operates as a landlord for nursing homes and long-term care facilities.
At the time, the sector was very beaten down due to worries about cuts to Medicare. That enabled us to snag an investment with an 8.9% dividend yield. Because the stock has appreciated so much, it currently offers a yield of 6.2%. But investors who got in on the original recommendation are enjoying a yield of 10.6% now that the dividend has increased from $0.40 per share in late 2011 to $0.47 now. A 17.5% increase in less than two years. That’s why I’m such an advocate of the dividend growth strategy. Most people would be thrilled with a 17.5% raise in less than two years. That doesn’t happen too often in the working world. But in the right dividend stocks, it can happen all the time.

But I digress. Back to whether Omega’s dividend is still safe.

As a real estate investment trust (REIT), Omega Healthcare must pay 90% of its earnings back to shareholders in the form of dividends. As a result, the company, and other REITs, do not pay corporate income tax on those earnings.
But anyone who has read my columns for even just a little while knows that I consider earnings to be just the beginning part of the cash flow equation. I don’t worry about earnings. I look at cash flow because cash flow tells the real story as to the health of the business.
A company could have great earnings, but if it has no cash left over at the end of the quarter or year to reinvest back into the business or pay shareholders their dividends, that’s a problem.
So let’s take a look at Omega’s numbers to determine if the dividend is indeed safe.
For the first half of 2013, Omega earned $0.76 per share but paid out $0.91 per share. Someone who looked at the company’s payout ratio would see an alarming 120%, meaning the company is paying out 120% of its earnings in the form of dividends.
That would scare off most investors because that is typically not sustainable. But this is a perfect example of why I don’t worry about earnings when it comes to dividend safety.
REITs often report cash flow as funds from operations, or FFO. For the first six months of the year, Omega’s FFO was $1.25 per share. That’s a big difference from $0.76 per share, especially when comparing it to $0.91 per share in dividends paid.
The reason for the big difference is non-cash items. When calculating net income, Omega expensed over $64 million in depreciation and amortization. Those are non-cash expenses. In other words, Omega did not actually pay out $64 million in cash for those expenses in the first half of the year. Yet those non-cash expenses lower net income.
Because a non-cash expense does not reflect the actual movement of cash, it is added back into cash flow calculations. A few other smaller adjustments and the company reported FFO of $144.5 million instead of $87 million in net income. That’s a big difference.

Now instead of a 120% payout ratio when using earnings as the basis, we have a payout ratio of 73% when using FFO. Also a big and meaningful difference.

Typically, I like to see a payout ratio of 75% or lower. That gives me the confidence that even if the company hits a rough patch, it will be able to continue to increase the dividend in the near future.
Omega Healthcare Investors has raised the dividend for 11 consecutive years. Last year, it raised the dividend twice during the year.
If Omega was able to increase the dividend even during very difficult periods of Medicare cuts and uncertainty, considering it has plenty of cash flow, I see no reason why it won’t be able to continue to raise the dividend for the foreseeable future.
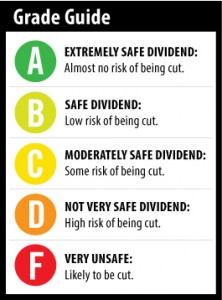
Dividend Safety Rating: A


...

Enhanced by Zemanta

A Reliable Account of the Great Depression

English: Murray Rothbard in the 90's
English: Murray Rothbard in the 90's (Photo credit: Wikipedia)
By Daily Reckoning


Washington, Aug.8, stock watch .- For his U.S. economic history class at UNLV, Murray Rothbard gave us the assignment to write a 10-page paper. The paper could be on anything we wanted it to be. However, we had to clear the topic with him.

When I proposed writing about the Great Depression, Murray was thrilled and rattled off a number of sources. Near the top of his list was a book he described as "fantastic, except it has a terrible title."

That book was a Laissez Faire Club featured selection -- Economics and the Public Welfare: A Financial and Economic History of the United States, 1914-1946 by Benjamin M. Anderson. As you can imagine, this is a book I have very fond memories of. My copy still has paper clips marking several pages. The text is underlined throughout.

Anderson was one of the first economists to provide a systematic account of the causes of the Great Depression. It remains the most reliable documentary guide to precisely what happened, before, during, and after. That is the essence of this book.

Anderson had feet both in academia and banking. He was on the faculty at Columbia and later at Harvard, and then joined National Bank of Commerce in 1918. Two years later, he moved to Chase National Bank to serve as economist and editor of the Chase Economic Bulletin.

He was also a world-class chess player and wrote what's been described as a brilliant preface to Jose Capablanca's book A Primer of Chess. Sadly, Anderson never saw Economics and the Public Welfare in print. He died of a heart attack just prior to its publication.

The years between the forming of the Federal Reserve and the end of World War II are some of the most interesting and formative years in U.S. economic history. Of course, the common narrative we constantly hear is the "monetarist" version parroted by Ben Bernanke that the central bank erred on the side of tightness and the money supply plunged, lengthening the Great Depression, and it was ultimately only fixed with a massive government works program known as WWII.

Instead, imagine having a correspondent on the ground keeping a rich, informed diary of the day-to-day, week-to-week, and year-to-year events as seen through the eyes of an Austrian economist, from the creation of the Federal Reserve through the Great Depression to Bretton Woods. That is what Economics and the Public Welfare is.

Anderson provides some theory along the way, but what this great book primarily does is chronicle monetary and economic events from the beginning of the Fed's operation to after the war. Politics, stock prices, and banking and trade data, plus a fast-paced narrative combine to make the reader feel like he or she is there.

As you would expect a bank economist would, Anderson provides a blizzard of numbers to provide emphasis for his story.

For instance, Anderson provides the principal resource and liability items of the Federal Reserve during the war. Total resources ballooned from $637 million in 1915 to $5.2 billion in 1918. On the liabilities side, Federal Reserve notes in circulation exploded as well, from $165 million to $2.5 billion, as did member banks' reserve deposits, which increased from $398 million to $1.7 billion.

As measured by percentage growth, this is greater balance sheet growth than the Bernanke Fed post '08 crash. Seeing these astonishing numbers triggers a realization: The years from 2008-13 amount to our own World War I. One hundred years ago, this sort of thing led to the post-boom crash of 1920 and unleashed the distortions of the roaring '20s that led to the second major crash of 1929.

Back in these days, the banking system also found itself flush with reserves. With bank reserves held at the Fed and not being lent out, the money market tightened and rates increased, despite bank credit expanding. After dropping to 1% in 1915, the bank call rate rose sharply to 7% in 1917. Bond yields also went up. "The pressure of firm money rates undoubtedly did a great deal to retard bank expansion and to hold it down to necessary things," Anderson wrote.

Of course, in similar fashion, bank reserves are also piling up at today's Fed, and money is, indeed, tight for the average person. Even so, the Fed of those days was not nearly as reckless as ours is today. The Bernanke Fed works overtime to keep money tight but rates uber-low in aid of the government, big banks, and speculators on Wall Street.

If you haven't ever heard of Benjamin Anderson and wonder about his hard money, anti-Keynesian bona fides (after all, he did work for a bank), this quote from Chapter 1 gives you an idea:

"The very inelasticity of our prewar (World War I) system made it safer than the extreme ductility of mismanaged credit under the Federal Reserve System in the period since early 1924. The whole world was, moreover, far safer financially when each of the main countries stood on its own feet and carried its own gold."
More than once, the reader will stumble upon a sentence that will make him smile. What's old is new again. We've taken note that Iowa farmland is looking bubblelike in 2012 and 2013. Sure enough, in his chapter on the 1920-21 crisis (what, you've never heard of that one?), Anderson offers a small section "Land Speculation -- Iowa."

In a footnote, the author remembers what an Iowa City banker told him. "I know that you economists say that land is only worth what it will produce, but it does look like some of this land around here is worth a thousand dollars an acre."

Plugging that $1,000 into the inflation calculator turns up a number of $11,100 per acre in 2011. It's almost eerie that the average price of land in O'Brien County, Iowa, last year was $12,862 per acre, a 35% increase over the 2011 average.

Not so famously, the government didn't intervene in those unenlightened dark ages. Wages and wholesale price levels crashed. The result, says Anderson: "In 1920-21, we took our losses, we readjusted our financial structure, we endured our depression, and in August 1921, we started up again. By the spring of 1923, we had reached new highs in industrial production and we had labor shortages in many lines."

The chapter I have bookmarked with the most passages highlighted is "Digression on Keynes." For nearly 20 pages, Anderson takes on Lord Keynes, whom he describes as "a dangerously unsound thinker." Anderson points out that Keynes heavily influenced Roosevelt and all economists who worked for the government. In The General Theory, Keynes targets a passage from J.S. Mill out of context to challenge the idea that aggregate supply and aggregate demand grow together.

The author points out that Keynes and his followers think in aggregates. He provides an aggregate supply function and an aggregate demand function. While human action is economics, there is no discussion of interrelationships. "Nowhere is there a recognition that different elements in the aggregate supply give rise to demand for other elements in the aggregate supply."

Our governments, corporations, and individuals pile up debt seemingly with impunity. The ideas of balanced budgets and living within our means are thought to be quaint. Modern Keynesians like Paul Krugman pooh-pooh the notion of balanced budgets and fiscal restraint. Where could he get such a notion? Anderson explains:

"Where economists generally have held that saving and avoiding unnecessary debt and paying off debt where possible are good things, Keynes holds that they are bad things. He disparages depreciation reserves for business corporations. He disparages amortization of public debt by municipalities. He disparages additions to corporate surpluses out of earnings."
There are entire books devoted to challenging Lord Keynes and The General Theory. But, Anderson's short chapter will provide you all the ammunition you need.

Near the end, the author reprints a memo he penned for private circulation that eventually found its way throughout government. The contents of the memo are considerable. However, one small snippet speaks to current Fed policy:

"Inflation is not something that you can turn off and on like water at a faucet. Inflation and deflation are not simple terms and they are not simple opposites. There is no financial Westinghouse air brake by means of which an inflationary movement can be tapered off and brought gently to an end without shock. Rather, inflationary forces engendered in defiance of sound financial policy may seem harmless for a long time and then suddenly break force into great violence."
There is an enormous amount of wisdom in this book. Everyone trying to understand monetary and economic policy during the Depression or today and the subsequent effects should have Economics and the Public Welfare loaded and ready to read cover to cover, or to refer to often. Anderson is an indispensable guide to government monetary policy, as it happened, that still haunts us today.

Being the kind of guy he was, Rothbard recommended Anderson's great book before recommending his own America's Great Depression. Both are amazing. But Murray had the benefit of Anderson's work in writing his. He cites him no fewer than 15 times.
...
Enhanced by Zemanta

A Rare Opportunity To Own One Of Our Top 'Forever' Stocks While It's 'Hated'

English: The New York Stock Exchange on the da...
English: The New York Stock Exchange on the day Bankrate.com was listed. (Photo credit: Wikipedia)
By StreetAuthority


Boston, Aug.8, stock trade .- Here at StreetAuthority, we love companies that have a wide moat around their operations and possess powerful long-term growth characteristics.
Investing in these companies is often quite simple. You buy shares -- and put them on the shelf. Year after year, they appreciate in value. Over the course of many decades, they deliver substantial investment returns. We call these "Forever Stocks."
Yet the ride isn't always quite so smooth for some "Forever Stocks." Even companies like GE (NYSE:GE) or IBM (NYSE: IBM) hit a rough patch, temporarily falling deeply out of favor with investors. And when that happens, savvy investors know to pounce, buying shares at marked-down prices.
Such an opportunity exists now with a company headquartered 5,000 miles south of the New York Stock Exchange. Brazil's CPFL Energia (NYSE: CPL) is a very good company having a very bad year. Shares are far from their recent highs, though as the dust settles, look for this stock to rotate back into favor.
Brazil's largest electric utility, CFPL was forced by the Brazilian government to roll back its rates in 2012 in an effort to lower consumer prices. Investors were none too pleased, as it became immediately apparent that the company's dividend couldn't be sustained: A $1.37 a share payout in 2011 had shrunk to $1 in 2012. This year, the dividend will likely be 80 to 90 cents a share. Yet that should mark a bottom, and in coming years, powerful demographic trends should help CFPL to again become a robust dividend grower.
Power To The People
Although the Brazilian economy is undergoing growing pains as it transitions from an emerging economy into a developed economy, the long-term trend of an expanding middle class implies an ongoing need: more power to run refrigerators, air conditioners, washing machines, TV sets and other appliances bought by folks who only recently developed the spending power to buy such goods.
And CFPL has been at the forefront of that trend. The utility's sales base has grown from $3 billion in 2004 more than $6.5 billion today. More importantly, the demographic trend is far from played out.
Just as we saw here in the U.S. in the 1950s, a rising middle class creates a new wave of spending on goods and services that generates a further employment expansion. We saw that in Japan in the 1960s and '70s and in South Korea in the '80s and '90s -- and we're now only part of that way through that process in Brazil. Though the Brazilian economy is currently the seventh-largest in the world, it is likely to crack the top five by 2030.
By CFPL's own estimates, Brazil's power needs will grow at least 5% annually through 2019. That may not seem like much, but it's a 40% increase from 2012 levels. (To put that in context, total electric power demand in the U.S. has risen less than 10% over the past decade.) The Brazilian government agrees, and its Ministry of Mines recently approved a 10-year power generation expansion plan that will deliver an additional 167 gigawatts to the Brazilian grid.
The Currency Kicker
Unlike U.S.-based "Forever Stocks," an investment in CFPL has an added wrinkle. Investors are exposed to currency movements, which can impinge or magnify stock price gains. Lately, it's been an impingement.
Since the summer of 2011, the Brazilian real has lost more than 30% of its value against the U.S. dollar, which has had a direct negative impact on Brazilian share prices as they are converted back into dollars. This currency could fall further in the near term, but long-term trade flows suggest it is already becoming quite undervalued, and the stage is set for an eventual rebound in the real. That would provide a tailwind to CFPL's shares (and its dividend) as well.
Risks to Consider: The majority of Brazil's electricity is derived from hydroelectric power, and a drought in the country would put a severe strain on the nation's utilities.
Action to Take --> CFPL Energia reports second-quarter results Aug. 8. At that point, management is likely to focus on the state of the current dividend as well as potential future growth for the payout. Though this stock has fallen by more than a third over the past 18 months, its current dividend yield, in the 5% range, along with dynamic growth prospects, should help this stock to move back into favor in the quarters ahead.
.

Enhanced by Zemanta

Wednesday, July 31, 2013

Bullish at the Bottom: The Supercycle Continues

By The Daily Reckoning


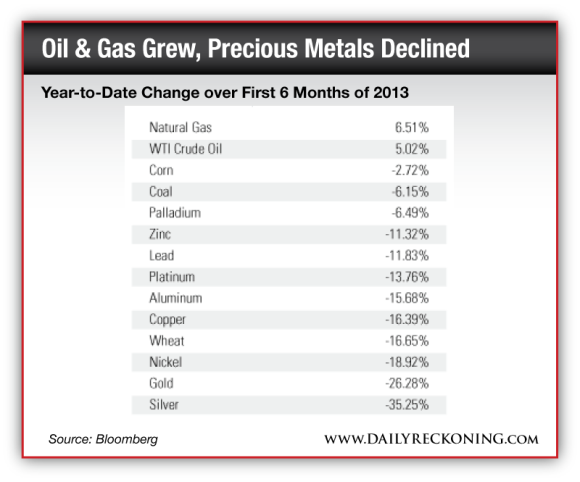
Chicago, Jul.31, stocks to watch .- It was a challenging first half of the year for most commodities, with only two resources we track on our Periodic Table of Commodities Returns rising in value. Natural gas and oil rose 6.5% and 5%, respectively, while silver lost a third of its value and gold lost a quarter of its price from the beginning of the year.

At first glance, the correction seems to support naysayers who believe the supercycle in commodities has ended, such as Credit Suisse analysts who had declared that the "era is over" in its digital magazine The Financialist.

We disagree. Instead, we see severe price declines as possible buying opportunities during this ongoing commodity supercycle.

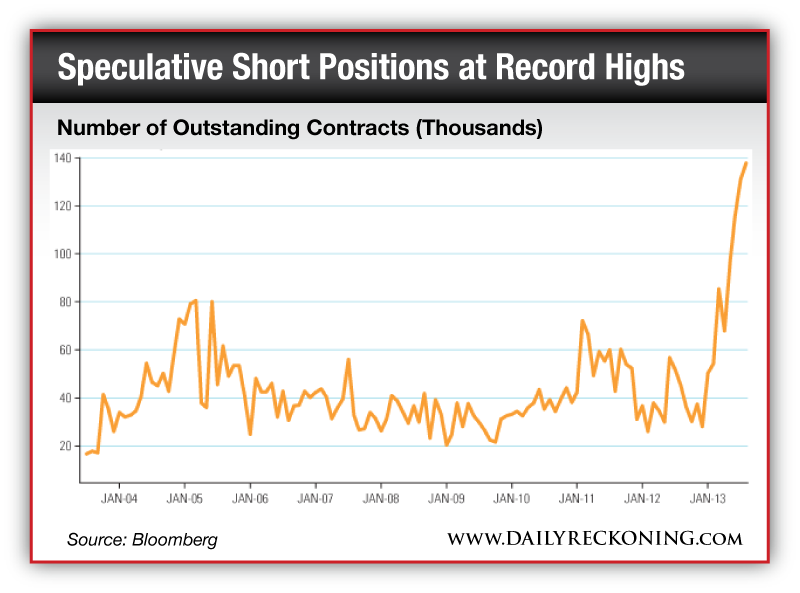
Consider the extreme pessimism on gold. As one measure of how bears have ganged up against the yellow metal, take a look at the spike in the level of short positions on the precious metal since the beginning of the year. As of the beginning of July, the number of outstanding gold short contracts was close to 140,000!


In June, while I was on CNBC's Squawk Box, Howard Ward, the chief investment officer of GAMCO Investors, made a bullish call based on the severity of the speculative short position:

"It was off the charts, just like it was a week ago for the short position and the yen, the pound and euro. Well, we've seen what happened to that. You wanted to be on the other side of that trade. I'll take the other side of the gold trade as well. Whenever so many people are on one side, I will take the other side. I think gold probably rallies between here and the end of the year."
There is certainly a pervasive sense of doom and gloom not only for gold, but for the entire resources space. BCA Research's Commodity & Energy Strategy report points to a recent Bank of America-Merrill Lynch fund manager survey, which shows that exposure to commodities is as low as it was at the end of 2008. The firm's firsthand experience reveals a similar investor reaction to resources: "Recent client visits to Europe, Australia and Asia confirm widespread pessimism toward the outlook for 'anything outside the U.S.,'" says BCA.

This is all music to a contrarian's ears because it's another sign of a bottom, but BCA advises taking a "patient approach to front-running the eventual cyclical rally in commodities." It's all about your time horizon, says the firm.

Supercycles are not short term; rather, they are long, continuous waves of boom and bust that can last several decades. While the overall trend is up, there are often short-term bursts of volatility. And looking over the next decade or so, the trends driving the current commodity supercycle remain in place.
“The Anguish on Bill Bonner’s Face When I Told Him Was Horrifying…”
Find out the full story behind this quote in a special presentation you don’t want to miss from Addison Wiggin, co-founder of The Daily Reckoning, when you CLICK HERE.

I recently read an insightful report on the subject from ETF Securities. In it, analysts highlight two primary long-term drivers.

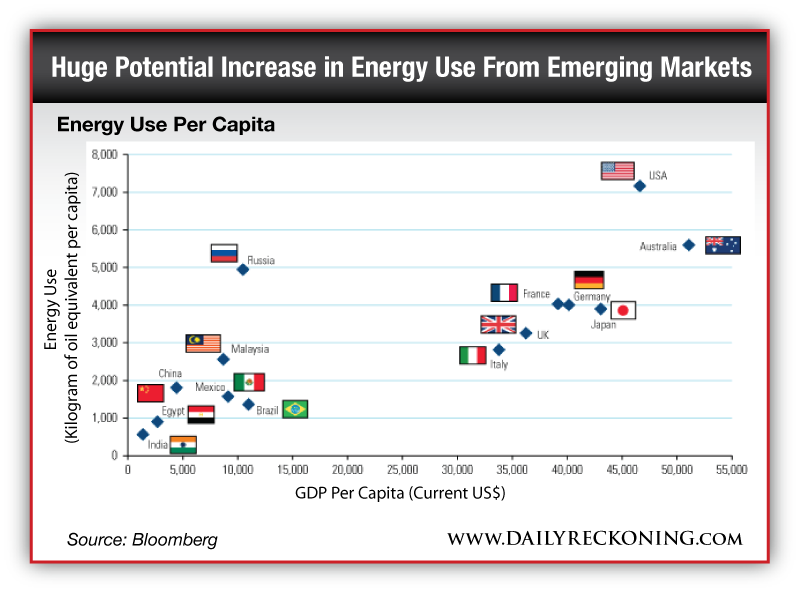
One entails the urbanization and industrialization trends that are "resource intensive," specifically those found in emerging markets with large populations. Take their energy use, for example, which is "only a fraction of the developed world equivalent," says ETF Securities. Developed markets, including Australia, France, Germany, Japan and the U.S., all have a higher GDP per capita as well as greater energy use than the emerging markets of Brazil, India, Mexico and China. These countries have significantly large populations, and "a relatively modest rise in per capita energy use will transform into a large absolute increase in global energy use."


According to ExxonMobil's 2013 Outlook for Energy report, the energy demand in developing nations "will rise 65% by 2040 compared with 2010, reflecting growing prosperity and expanding economies."

The second driver of the supercycle is the rising cost to produce many commodities, says ETF Securities. I've discussed on numerous occasions the difficulties facing gold miners, which have seen lower grades and a lack of discoveries. This has made mining the yellow metal more expensive. And as I indicated in a recent post, with a lower gold price, miners are rethinking projects that are too costly.

With many other commodities, resources companies are increasingly facing labor strikes, increased taxes and a backlog of projects that ultimately drive up the cost to mine and produce.

We agree with ETF Securities that the supercycle in commodities is alive and well. We are also in agreement with Credit Suisse when the firm explains that "the prices of individual commodities will no longer rise and fall together as they have for the last five years." Instead, investors "are going to have to focus on the specific supply-and-demand dynamics for individual commodities."

In this environment, an active manager with a wealth of experience can thrive. In our experience, commodity prices can move quickly, and an active manager is able to tactically shift assets into areas of opportunity.

So instead of trying to guess which commodity will outshine all others, we suggest diversifying across all commodities to try to smooth out the inherent volatility. See the approach that the Global Resources Fund (PSPFX) takes here.

And when it comes to gold, my position remains: Maintain a 5% weighting in gold bullion and a 5% weighting in gold stocks, selling when the price moves up significantly and buying when the opportunity presents itself.

.
Enhanced by Zemanta