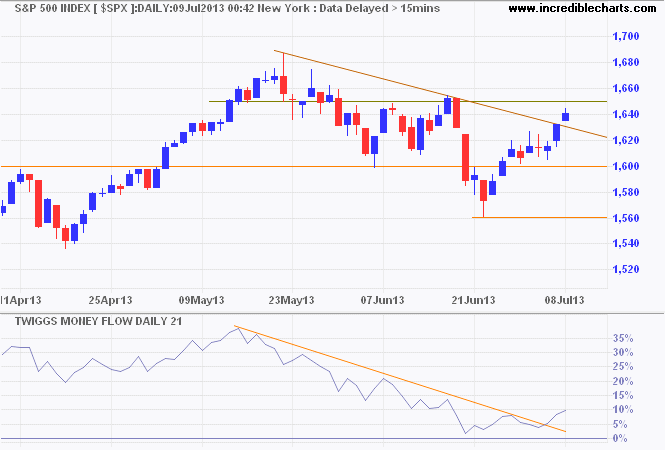
Sydney, Jul.9, stock watch .- The S&P 500 Index penetrated its descending trendline, indicating the correction has ended. Follow-through above 1650 would signal a primary advance to 1800*.
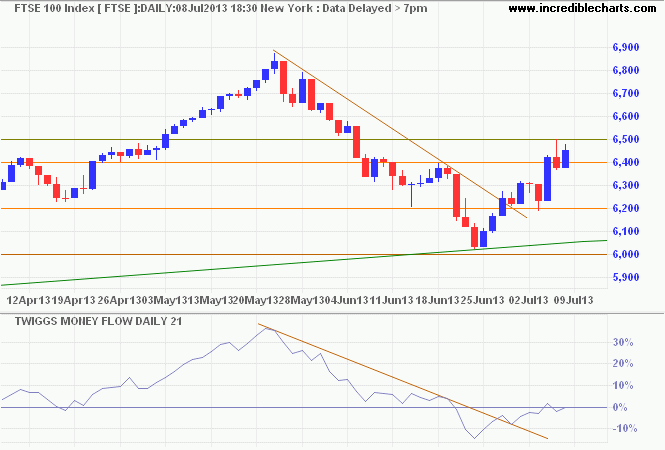
The FTSE 100 broke through medium-term resistance at 6400, confirming the correction has ended, after earlier penetrating its descending trendline. Follow-through above 6500 (from the March 2013 peak) would strengthen the signal, indicating an advance to 6900. Recovery of 21-day Twiggs Money Flow above zero would also strengthen the signal. In the long term, breakout above 7000 would offer a target of 8000*.
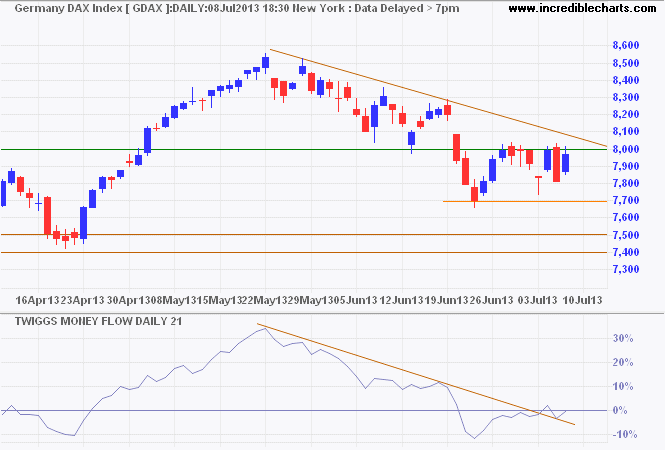
Germany's DAX is testing resistance at 8000. Breakout above that and the declining trendline would signal another primary advance, with a target of 9300*. Recovery of 21-day Twiggs Money Flow above zero would indicate medium-term buying pressure. Respect of resistance and reversal below 7700 is less likely, but would warn of a test of prmary support at 7400.
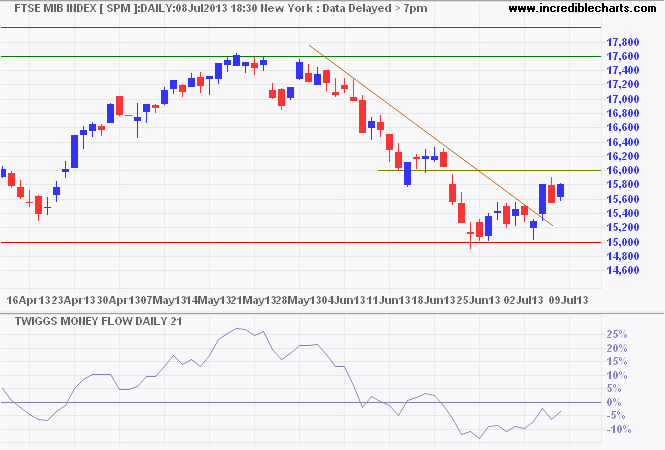
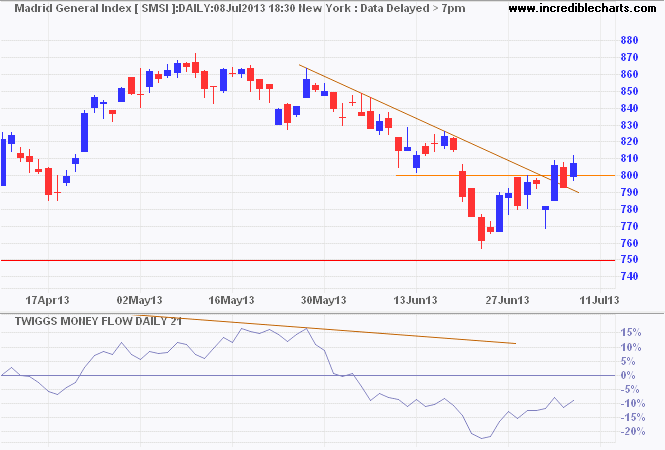
Italy's MIB Index is consolidating below resistance at 16000. Penetration of the declining trendline suggests the correction is over. Breach of resistance would signal an advance to 18000. Recovery of 21-day Twiggs Money Flow above zero would strengthen the signal. Respect of resistance is unlikely, but would test primary support at 15000.

No comments:
Post a Comment