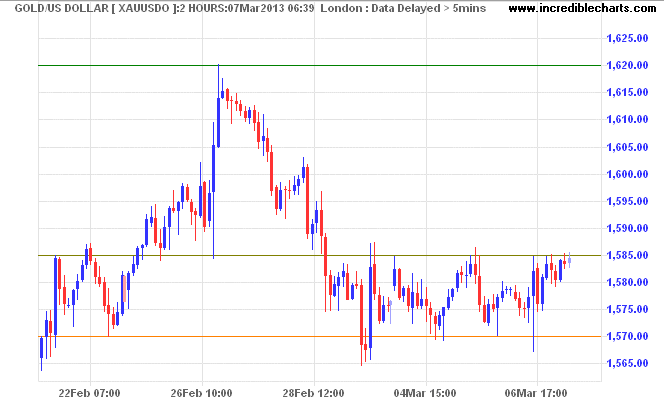
Sydney, Mar.7, stock trade .- Spot gold is consolidating between $1570 and $1585/ounce on the 2-hourly chart. Upward breakout would re-test the February 26 high at $1620. Downward breakout would test support at $1550.
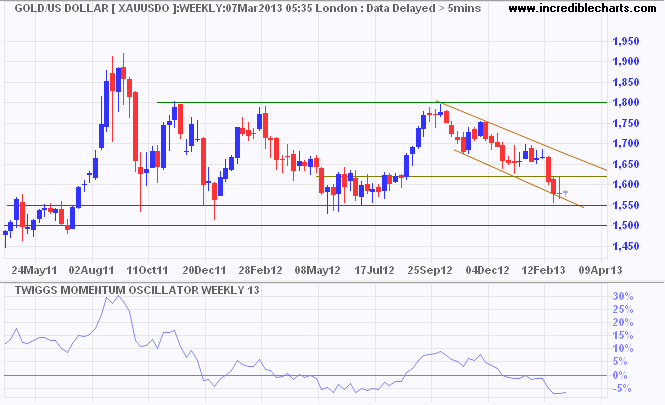
This can be seen on the weekly chart, where respect of support at $1550 would test the upper trend channel at $1620. Breakout would indicate that the correction is over. Failure of support would warn that the long-term up-trend is over and follow-through below $1500 would confirm a primary down-trend.
My conclusion is the same as last week:
I am not yet convinced that gold is headed for a primary down-trend. We may be in a low-inflation/deflationary environment right now but how long will it take for central bank expansionary policies to overcome this? Watch out for bear traps. Respect of primary support around $1500 could present a buying opportunity.
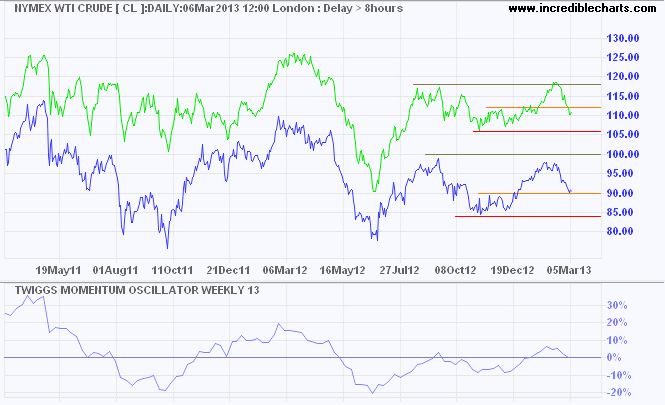
Crude Oil
Brent Crude and Nymex Crude continue to weaken but, for the moment, remain in a primary up-trend.retreated below support at $117/barrel, on concerns over the global economy. Failure of primary support at $106 and $84/barrel, respectively, would signal a primary down-trend. Falling crude would be a bearish sign for gold: demand for gold increases when crude rises.

No comments:
Post a Comment