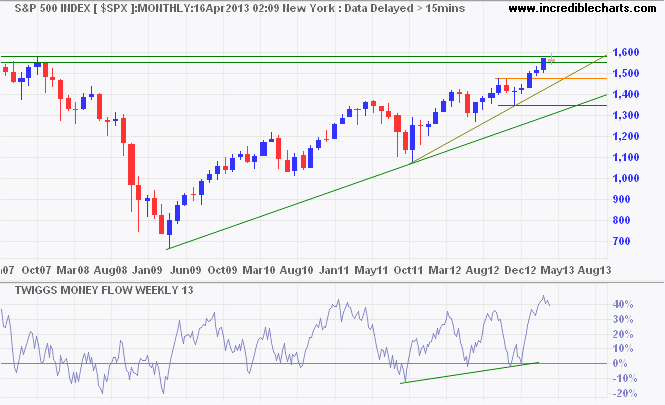
Sydney, Apr.16, stock investing .- The S&P 500 fell 220 basis points (2.2%) on Monday, blamed variously on disappointing growth figures from China, the fall in gold, and the Boston Marathon tragedy. I still suspect that the primary cause is the tectonic shift last week by the Bank of Japan.
"Where is the fall?" you may ask, when viewing the chart below. That is what I enjoy about monthly charts: they place daily moves in perspective. Breach of support at 1540 would indicate a small secondary correction, while breakout below 1490 would signal a correction back to the primary trendline. But the primary trend remains up. Only a fall through 1350 would suggest a reversal.


No comments:
Post a Comment