"No man can become rich without himself enriching others"
Andrew Carnegie


Showing posts with label stock investing. Show all posts

Tuesday, August 27, 2013

How to Spark a Fear Rally

Bull and bear in front of the Frankfurt Stock ...
Bull and bear in front of the Frankfurt Stock Exchange (Photo credit: Wikipedia)
By Rude Awakening

Baltimore, Aug.27, stock investing .- The sky is falling. Investors are panicking. But the market? The S&P is down about 2.5% from its August 2nd peak. What you're witnessing right now is the perfect recipe for a fear rally. I briefly mentioned Friday morning that investors pulled a net $9.4 billion out of U.S. stock funds last week. It's obvious the herd is terrified. Even the sentiment polls have sharply reversed from bullish to downright bearish…


"Turning to what caught my eye this week, sentiment polls showed some amazing spikes in fear on a less-than-5% pullback. As contrarians, this is exactly what you want to see," opines Ryan Detrick, Schaeffer's senior technical analyst. "It doesn't mean the market has to bottom here and now, but it increases the odds of a lasting rally once we get moving again."

Case in point: the American Association of Individual Investors poll. Detrick notes the bears (the poll now has them at 52%) have advanced for six consecutive weeks. That hasn't happened since the AAII poll first started 26 years ago...

Adding to the slipping sentiment numbers is hard evidence proving many investors want nothing more to do with this market. Turning back to fund outflows, you can clearly see investors have abruptly turned on this year's bull market.
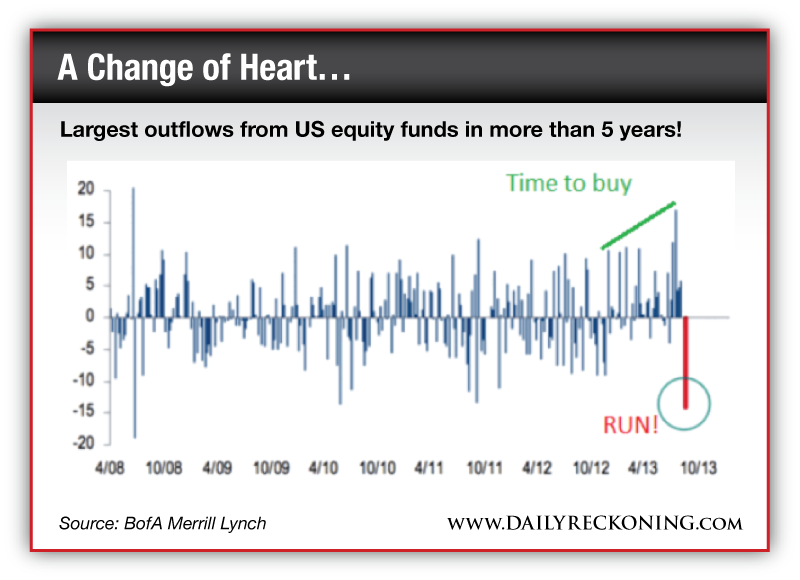

That's no mistake. We really did just witness the largest outflows from equity funds in more than five years. This fact is even more incredible when you realize that just two summers ago, eurozone fears helped crater the markets nearly 20%-- yet this month's small dip has triggered far more selling…

Fund outflows and newly bearish sentiment are setting us up for a bounce. While I still don't like the weakness we're seeing in the Dow, popular momentum stocks have held up well during this market pause. If these names continue to move toward new breakouts, you can expect the overall market's performance to improve as well over the next couple of weeks.

Fight any urge to "trade scared" this week. Set your brain to buy-the-dip mode while most investors are running from the market…

.
Enhanced by Zemanta

Get Ready for the Annual Retail Rebound

English: simulated Wal-Mart logo
English: simulated Wal-Mart logo (Photo credit: Wikipedia)
By Wealthy Retirement

New York, Aug.27, stock advice .- You may have come across this headline from a mainstream media outlet last Wednesday:

"Staples Plunges in One of Its Worst Sessions Ever"

The article pointed out how Wednesday's single-day plunge of 15% was one of the worst single-day losses Staples (Nasdaq: SPLS) has ever suffered... Second only to... drumroll, please... Aug. 15, 2012, when it fell 14.6%.

What struck me as odd (and bordering on lazy) was that the writer of this article - as well as the doomsaying commenters on the same article - failed to connect the dots. Think about it. The same company suffered near-15% one-day drops a year apart, almost to the day.

Instead, the writer wasted readers' time lamenting that retailers are reporting lackluster second quarter results as the consumer remains cautious. Yawn...

What I'm about to show you is that these two significant one-day drops (which both just so happened to occur on the day of the company's second quarter earnings release) are no coincidence. And once you understand what's happening, you can greatly improve your investing results - while substantially cutting your risk.

Here's what I mean...

Do You See a Pattern?

I'm just tossing this out there: Maybe Staples' second quarter results are consistently terrible. Maybe, you shouldn't buy Staples shares before its second quarter earnings release...

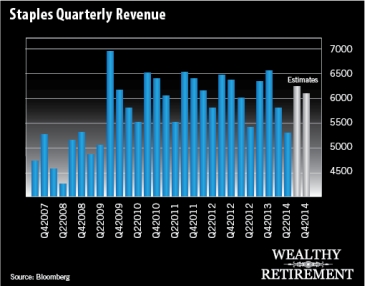
Let's take a look at Staples' quarterly revenue results:


What should be jumping out at you is that the second quarter for Staples is consistently its worst quarter... The only year it wasn't was in 2009, when the first quarter was the bottom.

We also see that the third and fourth quarters are consistently its strongest of the year.

That means the guy who wrote "Staples Plunges in One of Its Worst Sessions Ever" had the opportunity to tell investors that this is a frequent occurrence for the quarter... But he didn't.

Who's Buying in Summer? No One...

Now, let's look at the entire retail sector as a whole. There are plenty of headlines speculating on doom-and-gloom for the industry as second quarter results were largely lackluster.

In the following chart you'll see my Prime System Retail Index, which I use in Emerging Trends Trader. This index is made up of 21 companies. These include teen apparel retailers, big-box discount stores - such as Target (NYSE: TGT), Wal-Mart (NYSE: WMT) and Costco (Nasdaq: COST) - as well as mall-based chains and retail advertisers.

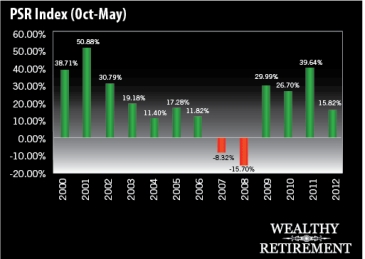
Here is how the Prime System Retail Index has performed from May to October since 2000 to today:


That's a lot of red isn't it?

In 14 years, there have been only five years of gains from May to October - during which the retail industry reports second quarter results. And 2003 and 2009 - the best years during this mid-year stretch - were both rebound years after market collapses.

So, you have to ask yourself: Is this year any different? Are shares of retailers acting outside of this normal seasonal pattern?

Currently, the Prime System Retail Index is down 3.99% since the start of May. The average return for this index from May to October over the last 14 years is -3.73%.

On average, eight companies in the Prime System Index will see a positive gain during the stretch from May to October...

And right now, there are exactly eight companies in the green.

Both figures are in line with the long-term average of the Prime System Retail Index.

That means what's unfolding right now is nothing that's out of character for the sector... In fact, this is exactly what we want.

Hello Holidays!

Obviously, the stock market is about buying low and selling high.

There's a pretty good chance if you're buying retail stocks in late spring, or before the second quarter earnings season, you're buying at a high point and are going to have to suffer through the seasonal low points we see for shares.

Now let's take a look at that same index and how the companies perform from October to May - the Prime Period for retail stocks (going from their low point to a high point)...


It's a totally different picture, isn't it?

Lots of green... And lots of solid returns year after year.

There were only two years of losses... The rest were all double-digit gains, with six years of gains of 20% or more.

The average return of the Prime System Retail Index from October to May since 2000 has been 20.63%.

On top of that, the average number of companies that have a positive gain during this Prime Period for retailers is 15 - almost double the number of those that see positive gains on average from May to October.

That's a pretty significant trend.

So, now you have to ask yourself: Is this year any different?

Are you going to let the mainstream media fear over retailers make you afraid? Or are you going to start creating a shopping list right now for retail stocks while there is blood in the streets and you know that the best time for the shares are ahead?

.
Enhanced by Zemanta

YouTube Boob Tube for the Taper Solution

Kicking Television
Kicking Television (Photo credit: dhammza)
By Daily Reckoning

Washington, Aug.27, online stock trading .- There are big bucks on the boob tube. When I was a kid, one of my mother's most common chastisements was to turn off the TV and go do something else. In her mind, anything was better than sitting relentlessly in front of the boob tube watching inane programs.

Well, it seems Ma was wrong. Not only did my retinas not burn out from staring at the TV, but I've managed to make over 128% so far this year by simply keeping an eye on it. I'd like to highlight some television companies that may be worthy of your investment dollars--especially if you're looking for a play that won't be affected by the Fed's taper talk.

Because despite what you may have heard, television is far from dead. On any given day, some 2.2 trillion hours of television are being watched across the United States, according to Nielsen.
More surprisingly, people watch television over 4.6 times longer than they surf the Web, according to recent data from New Media TrendWatch.

So it boggles my mind that so many stock-picking gurus have been touting Web companies with questionable revenue streams. Consider Facebook, which has barely made it back to its IPO price. In fact, more than 54% of the Web company stocks tracked by the Dow Jones Internet index have lost money or trailed the S&P 500.

Meanwhile, we've been quietly racking up gains with what's really making money in the modern media age.

Simply put, it pays to advertise. Almost all media live and die by advertising revenue. And advertisers have a very good reason to continue throwing their money at television stations -- nothing else can match their scope.

Television has the reach of nearly 89% of the total U.S. population. Radio offers only a scant 58.8% reach. Newspapers fall to a mere 36.1% of the nation. (No wonder The New York Times and Washington Post both dumped newspaper assets.)

The only thing that comes close to matching television's reach is the Internet -- currently hitting 73.1% of the population. Good, but nowhere near the total reach of television.

And advertisers know that not only do they reach more folks through television, but also they get more action. Advertising industry studies show that nearly 40% of consumers first learn of brands that they buy from TV ads, compared with only 8.7% from Internet ads.

Furthermore, 37.2% of people cite television ads when making purchasing decisions, against a paltry 5.6% who cite Internet ads.

This all points to the obvious -- that television controls the vast majority of ad spending. It now makes up 54% of all U.S. ad spending… up from 52% just a few years ago.

But there's even more good news on the television ad market. Local television websites continue to draw in new viewers, and ad dollars have followed. Local online advertising revenues nationwide are up over 175.19% over the past five years -- 1.3 times higher than the overall growth of Internet advertising spending.

Of course, audiences aren't the only thing about television that's growing. Televisions themselves have gotten huge. Decades ago, a 25-inch screen was a big deal. Today, you'll find screens reaching 40, 50, 60 and 80 inches… and even bigger. (Most of them built with technology from another favorite company of mine, Samsung Electronics. But that's a story for another issue.)

But the same concept of bigger is better is what's happening for television station companies as well. They're expanding into markets around their home regions and nationwide.

There are some key reasons for this. First, as noted above, television dominates media attention and spending. So the more stations you own, the better.

Second, expanding regionally helps lower costs. If you have news reporters in each locality, you can have fewer covering larger-scale events.

Also, when it comes time to buy content for your television stations, the more eyeballs you can reach, the better the deals you can cut with distributors.

Increasingly, the bigger television companies with more market controls are even getting national networks to pay them to put their content out on local broadcasts. And the same goes for cable and satellite providers. They know all too well that folks demand local news and content, as well as network broadcasts that all have to flow through or from local television companies.

Third, there's been a major shift in the way television is broadcast -- and it's continuing to evolve, setting up another major growth area for television broadcast companies.

Back in 2009, the U.S. government mandated a switch from analog television broadcasting to digital.

But with the newer digital broadcasting standards, broadcast television companies discovered they were using less spectrum than they were allotted. So now companies are using that excess spectrum to roll out additional channels that are even more tailored to specific viewer groups.

This sets up whole new revenue streams that advertisers and content providers are eager to work with, resulting in more cash for broadcasters.

And it gets even better. Wireless data for smartphones and tablets demand more and more bandwidth -- and companies like Dish Network and even the U.S. government want to buy, or at least contract to use, some of the excess spectrum broadcasters are sitting on.

This means that broadcast companies are sitting on an increasingly valuable additional asset.


1.3 times higher advertising spending than overall growth in Internet spending? Groovy.

Armed with all of this good news, leaders in local television are scrambling to buy more local stations and other broadcast companies.

Deals are now coming at a fast pace. Tribune has upped its television companies by 100%, to 42 nationwide. Its latest deal bought out 19 stations from privately held Local TV Holdings. And Gannett is in the process of expanding its station count to 43, with the additional 20 coming from its deal to absorb Belo.

For Lifetime Income Report readers, I've picked out three specific broadcasting companies -- with market caps of a billion dollars or less -- that make for very tempting new targets for speculative investors.

...
Enhanced by Zemanta

Tuesday, August 13, 2013

Follow the Smart Money’s Lead on Any Correction

Image representing Research In Motion as depic...
Image via CrunchBase
Large institutions have indicated that they are ready to pounce on weakness


With about 90% of the S&P 500′s companies reporting earnings, the group is on track for a gain of 2.1% for Q2. FactSet estimates that this is a slowdown from the 3.4% reported in Q1.
Gains by BlackBerry (BBRY) and Apple (AAPL) helped the technology sector lead and also boosted the Nasdaq 0.27% for the day.
At Monday’s close, the Dow Jones Industrial Average was off 6 points at 15,420, the S&P 500 fell 2 points to 1,689, and the Nasdaq was up 10 points at 3,670. On the NYSE, advancers slightly outpaced decliners, but on the Nasdaq, advancers were ahead by 1.3-to-1.

Chart Key
The small- and mid-cap stocks have been leading a lethargic move higher. Despite marginal advances, the Nasdaq received a MACD sell signal Monday.
Support is initially at the index’s 20-day moving average at 3,630, and then there is a band of support at 3,575 to 3,630. Major support is at its 50-day moving average at 3,520 and the May closing high at 3,523.
The Russell 2000 small-cap index closed above its 20-day moving average Monday, but is still under pressure from a weak sell signal from MACD. MACD is turning up and could cause an attack on the high at 1,063. Support is first at 1,042, then the 50-day moving average at 1,014, and finally at 1,000.
Conclusion: With over 90% of the S&P stocks reporting, the flow of news moves back to the Fed and comments from its regional presidents. With that in mind, I suggest a cautious approach. But any correction should be used as a buying opportunity, since recent comments from the large institutional houses indicate that they are ready to pounce on weakness.
...
Enhanced by Zemanta

3 Gold Facts You Can't Ignore

Gold Key, weighing one kilogram is used to acc...
Gold Key, weighing one kilogram is used to access a ten digit account number which is known only to the bearer of the Gold Key. (Photo credit: Wikipedia)
By Rude Awakening

Baltimore, Aug.13, stock advice .- There are three facts about gold you need to know right now…


Fact No. 1: Since dipping below $1,200 six weeks ago, gold futures have jumped higher by nearly $130.

Fact No. 2: Beaten down mining stocks have actually outperformed gold over the past six weeks. The widely followed Market Vectors Gold Miners ETF has jumped more than 8% since the end of June.

You might find these first two facts exciting. A potential gold comeback could mean a new trade—or even new life for an old position you had left for dead.

But before you clear out a spot in your portfolio for a brand new gold position, there's one last fact you must know. Out of everything I've already told you today, this piece of information is far and away the most important truth about gold today.

Fact No. 3 is simple. It's true. And it trumps every other analysis or assumption about gold. The third fact is this: Even as futures perk up this morning, gold remains stuck in a painful downtrend.


I told you a couple of weeks ago that you should expect choppy action from gold futures as traders try to sort out the possibility of a late summer rebound. That's exactly what we've seen. Gold futures are up another $13 this morning to $1,325 after dropping as low as $1,275 late last week.

Of course, the big downtrend doesn't mean higher prices aren't possible. All trends eventually reverse. But if you're thinking about playing gold, its larger downtrend must remain the first and last piece of information you consider before pulling the trigger. Ignore it and you could get badly burned.

Keep a close eye on $1,350. A break above this price is a fairly good indication we could see higher prices soon. But failure at $1,350 could cut gold's late summer comeback short.

You know the drill. Check your emotions at the door before backing up the truck. If you do jump into a new gold position, it's critical that you keep it on a tight leash. Risk remains elevated. Consider yourself warned…
...
Enhanced by Zemanta

Gold Chart of The Week

By INO
Chicago, Agus.13, online stock trading .- Each Week Longleaftrading.com will be providing us a chart of the week as analyzed by a member of their team. We hope that you enjoy and learn from this new feature.
Weekly Gold Report August 12th through August 16th
Summer markets and light volume trading should continue to be the focus for the upcoming week. Despite the fact that the next five trading days have quite a bit of data to present, the reports are divided equally between the United States and Europe, along with a few from Japan and Great Britain. This mix of intermarket and intercontinental data should provide decent intraday volatility to trade, but I do not expect any fireworks.
The two standouts this week will be Retail Sales in the US and GDP reports from Germany, France and the Eurozone. Any one of these reports can provide some nice movement in the Currencies and Stock Indexes, but lighter volume trading should cap any major movement.
The Gold Futures have been a tricky market to predict from a fundamental perspective, which also makes a multi-day trade difficult. Over the last few years, Gold would look for things like a weak US Dollar or a weak Stock Market to provide a reason to rally or sell off. There was also the “Risk On-Risk Off” movement last year that provided the occasional curve ball. But lately it seems more impossible than ever to tie the direction of Gold to any one fundamental idea. But you CAN trust technical analysis.

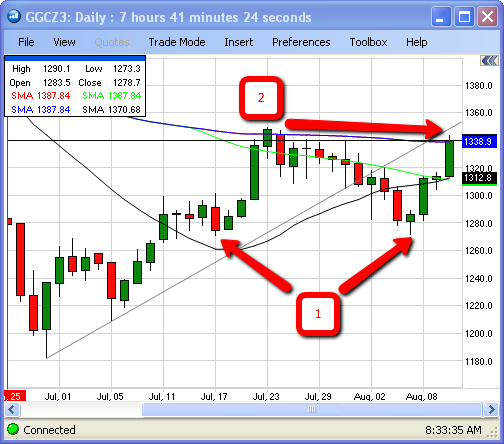
The above chart is a daily of the December Gold Futures. Arrow #1 points out last weeks low that was a test of the prior chart consolidation from mid-July. A hold at this prior low provided a steady bounce that is now on its way to a test of a prior trendline that was supportive but now is seen as resistance. Not only is $1350 significant because of this trendline (identified by arrow #2), it is also significant because it is a retest of the July 23rd high print. An early climb off the open on Monday morning seems to me like a great way to bait traders into a long position before turning the market upside down. I will let the closing price of Gold today prove to me whether this idea is right or wrong.
Good luck this week and please feel free to reach out to me directly if you would like to discuss trading Gold Futures or any other Futures or Futures Options. I will be happy to hear from you.
.
Enhanced by Zemanta

Wednesday, August 7, 2013

Profit From a Massive “Secret Shale” Formation

By Investment U

Austin, Aug.7, stock investment .- Most investors know about the huge and lucrative Marcellus and Utica shale formations. But recently, drillers have targeted another, little-known shale formation sitting above the other two. Few investors have ever heard of this third reservoir. And fewer than two dozen wells have been drilled into it.

But initial measurements suggest it just might be the largest gas producer of them all.

It's one of the industry's best-kept secrets. Let's go exploring.


You can see in the map below the three shale gas plays stacked on top of one another in the Pennsylvania-West Virginia area. The well-known Marcellus and Utica formations are two of them. The third is called the Devonian.

Only a few drillers are targeting it.


Who's Drilling the "Secret Shale"?

Range Resources Corporation (NYSE: RRC) arrived in 2009. If its initial test pans out, Range may be able to drill at some sites into the Marcellus, Utica and the Upper Devonian from a single drill pad. The economics of this are clearly compelling.

Energy in Depth, an industry group, interviewed Range Resources' Matt Pitzarella. "It's still very early," explained Pitzarella, "but we're very excited about the potential [of the Upper Devonian drilling], especially in southwestern Pennsylvania."

Consol Energy Inc. (NYSE: CNX) is better known as a coal producer. But as coal loses favor as a fuel source for power plants, Consol is targeting the Upper Devonian while it focuses more on its natural gas business.

The company has already drilled its first successful Upper Devonian natural gas well in Pennsylvania. The well produces about 3 million cubic feet of natural gas per day. Consol says that about 300,000 acres of land under its control have commercial potential for Upper Devonian shale drilling.

Rex Energy Corporation (Nasdaq: REXX) has so far drilled a single well into the shale in Pennsylvania. The well tested at 3.1 million cubic feet of natural gas per day.

Chesapeake Energy Corporation (NYSE: CHK) has to date drilled a single Upper Devonian well in West Virginia. It has several permits to drill into the formation in western Pennsylvania. Chesapeake remains tight-lipped about its drilling results so far, as well as its plans for the Upper Devonian.

How to Play It

What's the best way to invest in this promising shale formation? All four of the above companies are already major players in the Marcellus. The fact that any or all of them could hit pay dirt in the Upper Devonian just adds to potential shareholder value.

But one driller has a big jump on all of them. Pittsburgh-based EQT Corporation (NYSE: EQT) recently announced it has drilled eight wells in the Upper Devonian.

EQT's strategy is to drill into the Marcellus and the Upper Devonian from the same well pad, saving time and money. Its development drilling success rate over the past three years is an impressive 99.6%. Its production growth for 2012 was 70% over that of 2011.

EQT has drilling rights on nearly 3.5 million acres spread across the Appalachian Basin. It estimates its Upper Devonian proven and probable reserves at 2.4 trillion cubic feet. It expects to drill 22 additional wells in the formation before the end of this year.

Why invest in EQT? It's the earliest-in player in the Upper Devonian and has one of the lowest cost structures in the natural gas sector. Besides drilling for natural gas and natural gas liquids, EQT has both gathering and transmission pipeline systems.

The company boasts an 84% institutional ownership and has received numerous price target upgrades. Its stockholders have been richly rewarded over the past year as EQT's shares have jumped over 60%. There's every reason to expect similar results moving forward.

We'll keep an eye on these five companies for additional updates on their progress drilling into America's "Secret Shale."

...

Enhanced by Zemanta

Housing’s Stealth Recovery is Finished

English: Flag of San Francisco Español: Bander...
English: Flag of San Francisco Español: Bandera de San Francisco (Photo credit: Wikipedia)
By The Rude Awakening

Baltimore, Aug.7, stock advice .- The much-heralded housing recovery is over.


No, you won't see a bunch of new foreclosures in your neighborhood. And I doubt the value of your home will plummet. But the big, first phase of the housing market's under-the-radar rise is finally cooked.

That means no more easy gains from homebuilding stocks. These names were great buys in 2011 and 2012. But right now, they just aren't performing.

The simple fact is that expectations have run wild. The rebound in the real estate market isn't a secret anymore. People all over the country can see the pickup in sales and construction in their respective towns. They've bet big on the homebuilding stocks. Now, it's a crowded trade.

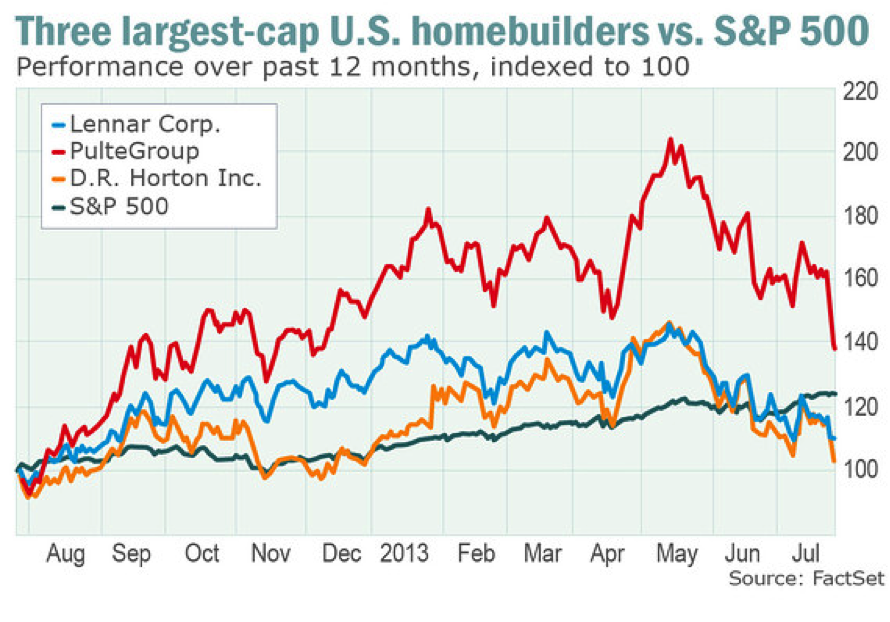
"While they have made great strides in the past year, home-builder stocks have become volatile recently as investors deal with mixed economic housing data, rising mortgage rates, and, in the cases of a few overheated markets such as San Francisco, worries that the market is setting up for another painful collapse," reports MarketWatch.


While I think concerns of another collapse are overblown at this juncture, it's not a stretch to say that homebuilder names could keep falling for some time. In fact, the broad market is absolutely trouncing the housing sector stocks right now. The iShares Dow Jones U.S. Home Construction ETF has dropped 10% over the past three months. It's up less than 6% on the year, compared to a 20% gain in the S&P 500.

Again, I don't think we're headed toward another blow-off top in the real estate market. Remember, homebuilders have been sitting on their hands for years. The number of completed new homes for sale remains at the lowest level ever recorded in 40 years of National Association of Home Builders data. You'll have a chance to find value in homebuilder names somewhere down the line.

But right now, investors are looking elsewhere for gains. And unless you're extremely patient and willing to sit through another leg lower, you should ditch these stocks until they begin to show signs of life once again…
Enhanced by Zemanta

A Stock Below $5 You Can Hold 'Forever'

Image representing Apple as depicted in CrunchBase
Image via CrunchBase
By StreetAuthority

New York, Agus.7, online stock trading .- It really shouldn't matter a lick what price a stock is trading at. There is no fundamental difference between a stock with 1 million shares trading at $50 and a stock with 10 million shares trading at $5.

Then again, there are people whose interest is piqued when they see a low price tag. It's one of the reasons why many companies will split their stock. The lower price tag will sometimes entice more buying.

When you consider the rule of large numbers, the phenomenon of lower-priced stocks rising faster than their higher-priced brethren does make a little sense. After all, for a stock trading at $5 to gain 50%, it has to only rise $2.50. But for a $100 stock, the same move takes $50.

Investors aren't always rational, and that $2.50 move seems a lot smaller than a $50 rise, even though they are the exact same in percentage terms.

With this in mind, I wanted share one of my growth stocks to buy and hold forever that's trading for less than $5...

But first, remember that I look for a very specific kind of company. As I've explained recently, by allocating just 20% of your portfolio to the "Next Big Thing," you increase your chances of making a lot of money in the stock market.

And I'll be honest, there's really no secret formula to finding game-changing stocks. The bulk of it comes down to a lot of research and making bold calls on where a company or technology will be a year, five years, or a decade down the line.

The thing is that no matter how much research goes into an idea, there is never any guarantee it will be a winner. If anyone -- even Warren Buffett -- says they can guarantee you a certain profit in the market, you should run away... fast.

I know not every idea can be a huge success. That's OK. But that doesn't stop me from looking for the handful of potential winners that could soar hundreds or thousands of percent like Netflix (Nasdaq: NLFX) or Apple (Nasdaq: AAPL) did.

And where have I found some of the highest-scoring winners? Oddly enough, it's been in stocks with low price tags.

A Toll-booth Operator For The Underground Energy Revolution
As prices at the pump start to inch higher -- and that's happening -- there's little doubt the nation will again begin to look at alternative fuels. There was some hope that electric vehicles like the Chevy Volt would help. The trouble is, no one's buying these cars despite heavy government incentives. So with electric vehicles out, the real question is what's in.

That means answering one question: How can we get cheaper gasoline?

The answer is biofuel.

The federal government has been interested in how it can wean the nation off petroleum which the U.S. must import. Of course, the shale boom is helping out with this problem, but that's just part of the equation.

The best solution for an alternative, so far, has been ethanol. The pure alcohol derived from the starch in corn that can be blended with gas, reducing the amount of petroleum the country needs to use.

Now, federal support of corn-based ethanol has waned. But another type of ethanol, made from a different part of corn or another plant entirely, is still very much in play.

A key step toward the meaningful use of biofuels dates back to the George W. Bush era, when a bill passed that codified a federal biofuel production quota into law. It calls for a range of biofuel, not only corn-based ethanol but also sugar-based fuel that the feds call "advanced biofuel." This is code for cellulosic ethanol, which is comes from a type of sugar that's found in all plant life.

This sugar is hard to get to. For much of recorded history, only animals, notably cows, have been able to get energy from this type of sugar, which is locked tightly in the cell walls of plants.

But now, using specially designed enzymes, producers can "tease" out the sugar, ferment it into ethanol and make biofuel from agricultural waste like wheat straw or corn stovers, from special grasses or even scrap wood and paper.

The companies in this space have been much maligned. For years, cellulosic ethanol and the idea of growing our fuel has been dismissed as pie-in-the-sky dreaming. But the science has caught up, lawmakers have embraced it -- and now a lot of major oil companies are bowing to the inevitable future of biofuel.

Lucky for us, there are a plenty of game-changing companies in the space, and a few have prices under $5 per share. My favorite is Dyadic International (OTC: DYAI).

Dyadic is a leader in the special proteins that refiners introduce to get the sugar-to-ethanol process going. The company makes the enzymes that tease out the sugar contained in all plant life -- without its products, all you have is a pile of worthless mulch.

Dyadic's business model is simple but elegant. It doesn't grow plants. It doesn't build $300 million refineries. It simply sells the enzymes to the cellulosic ethanol producers and receives a royalty for each gallon produced. Dyadic is a toll bridge operator. And every gallon of cellulosic ethanol that leaves its customers' factories has to pay the toll.

That's also why I call it one of the best growth stocks to hold forever. Forever is a long time, but I'm confident that as time passes, Dyadic's products will develop and new markets will emerge, and this little company will collect a royalty on more things than we can count.

Of course, with a stock that focuses on an unproven technology like biofuels, there a lot of risks involved that could lead to a fall in share price.

But by following my 20% Rule with stocks like Dyadic, you will limit that risk and potentially move the needle on your portfolio.
...
Enhanced by Zemanta

Tuesday, July 30, 2013

A Disaster for Stock Prices

Image representing Nokia as depicted in CrunchBase
Image via CrunchBase
By Wealthy Retirement

Boston, Jul.30, stock investing .- Every Wednesday, I write The Safety Net column, where I examine the dividend safety of a stock that is suggested by readers.

The importance of dividend safety might be obvious to some, but there are investors who yawn at the mention of a dividend. For them, combine the word "safety" with "dividend" and it's a one-way ticket to Snoozeville, which I hear is lovely this time of year.

But the importance of dividend safety isn't just a matter of collecting $40 in dividends versus $20 if the dividend is reduced. A dividend cut can be disaster for the stock price too.

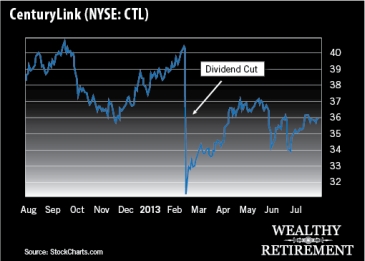
Last week, in my discussion of Windstream (Nasdaq: WIN), I mentioned the poor performance of CenturyLink (NYSE: CTL) after it cut its quarterly dividend to $0.5425 from $0.725. The stock tanked 23% on the news.


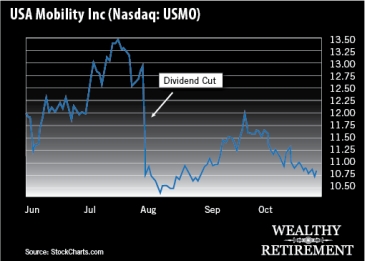
In August of last year, USA Mobility (Nasdaq: USMO) slashed its dividend in half, cutting the quarterly payout to $0.125 from $0.25. The result was an 18% plunge in the stock. It has since recovered, but shareholders had to wait eight months to be made whole again - although they're now receiving a much smaller yield.


There can be lots of reasons a company will cut its dividend. Usually, it's because it has to. It simply isn't making enough money to pay shareholders and meet its other obligations like paying interest on debt, or keeping the lights on and the driver for the CEO.

Sometimes management wants to hang on to the cash in order to fund growth plans such as expansion or an acquisition. Other times it prefers to use the money to buy back stock. I always prefer the dividend. Academic studies have shown that stocks perform better when a strong dividend is paid versus a stock repurchase plan.

Looking for Clues in Cash Flow

I spend a lot of time in my Safety Net columns explaining how I determine the safety of a dividend.

It's all about the cash flow. (I'm not so concerned with earnings because earnings are easily manipulated and include all kinds of non-cash expenses, such as depreciation, that artificially lower the profit.)

As an example, let's take a look at Nokia (NYSE: NOK).

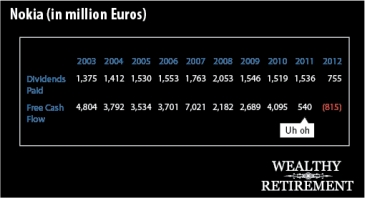
Last year, the company cut its dividend in half. This year, it failed to pay a dividend for the first time since 1871. That's not a typo. Nokia paid a dividend to shareholders every year starting six years after the American Civil War. This year, it did not.

When we look at the last 10 years' worth of free cash flow, we see that Nokia was generating billions of dollars in free cash flow until 2010, when it slipped to only €540 million. I say "only" €540 million because it was paying out over €1.5 billion in dividends. In 2011 and 2012, free cash flow swung to a negative number. That means that it cost the company money to run its business.


That's not sustainable for paying a dividend.

So management did the financially responsible thing: It cut and then abolished the dividend.

The stock was punished, falling from over $11 in 2011 to a low of $1.63 late last year. It rebounded to $4 but is still well below where it traded before the dividend cuts.

But investors had a warning in 2011 when free cash flow fell dramatically. And by 2012, they should have known the dividend was in jeopardy as free cash flow numbers turned negative.

It's important to understand the safety of your stocks' dividend if you don't want to wake up to a 15% or more haircut in the stock price. That's the kind of excitement no one wants.
...

Enhanced by Zemanta

What I Told Rand Paul

Official portrait of United States Senator (R-KY).
Official portrait of United States Senator (R-KY). (Photo credit: Wikipedia)
By Investment U

Las Vegas, Jul.30, stock advice .- Earlier this month, I spoke and debated on several panels at FreedomFest in Las Vegas, the annual libertarian conference described as "the world's largest meeting of free minds."

These liberty-minded individuals are upset with the federal government. And who can blame them? Government spending is out of control. The federal budget is awash in red ink. In the absence of genuine reform, entitlement programs are headed for the elephant's graveyard. And dissatisfaction with Congress is lower than ever.

Many of these irate citizens, however, are taking their political convictions into the investment arena and drawing some wrong conclusions. In particular, many have avoided the stock market entirely over the last five years.

That has been a mistake. And it is almost certain to remain one in the future. I'll readily concede that I don't know what the stock market will do over the next six weeks or the next six months. But over time, share prices follow earnings. And those earnings will almost certainly trend higher over the next few years.


Things Are Looking Up

Why? Just look at all the positives. Short-term interest rates are near zero. Inflation is MIA. The housing market is recovering. The dollar is rising and recently hit a three-year high. Thanks to fracking and horizontal drilling, we are experiencing an energy revolution in this country. And corporate earnings are at an all-time record.

Yes, things are dysfunctional in the public sector. But they are improving in the private sector. And government may get better after the next election.

One evening in Las Vegas, I had dinner with Sen. Rand Paul, a likely Republican candidate for the 2016 presidential election. Paul is sympathetic to the view that the government hinders businesses with too many taxes and regulations, but he said those issues don't resonate with young people. He plans to emphasize the intrusive nature of the federal government by arguing against government surveillance methods that track innocent citizens' phone records and Internet movements.

I told him I believed that was important, but if he wanted an economic issue that would resonate with young people he should clearly describe the debt we baby boomers are laying on them.

The numbers are almost too large to fathom... until you break them down. For instance, the U.S. national debt is currently $16.9 trillion. But that is meaningless until you explain that it amounts to more than $148,000 per taxpayer. Unfunded liabilities for Medicare, Social Security and the Prescription Drug Benefit are $124.9 trillion... or an additional $1.1 million per taxpayer.

We're handing young voters an IOU - that we have no intention of repaying - totaling nearly $1.25 million per taxpayer. (Talk about a fairness issue.) Now that should get young people's attention.

Private Trumps Public

But as bad as our federal budget situation is, it is trumped by all the positive things happening in the private sector. Every day companies are knocking themselves out to make products that are better, cheaper and longer lasting. They're creating new materials, better technologies, and improved medicines and medical devices. They are fulfilling all our wants and needs and creating new ones.

So don't let government bungling keep you out of the stock market. The free enterprise system is built on a durable, three-pronged foundation. No. 1, everyone has economic needs: food, clothing, shelter, heath care, transportation, communications, etc. No. 2, self-interested individuals start and expand businesses to meet those needs. No. 3, businesses need money to start and grow and that requires well-functioning capital markets.

Human needs, businesses and capital markets aren't going away. And the stock market is the quintessence of capitalism: the private ownership of the means of production.

So organize around your political views. Raise money. Donate money. Cast your vote. But don't take your frustrations out on your financial future.

Owning a portfolio of profitable businesses has always been the best way to build and protect a financial fortune. And it always will be.

.
Enhanced by Zemanta

Hand Off to a New Fed Chair is Well Timed

Official portrait of Federal Reserve Chairman ...
Official portrait of Federal Reserve Chairman Ben Bernanke. (Photo credit: Wikipedia)
By INO

Washington, Jul.30, online stock trading .- It is as notable as a 2nd term president handing off the big problems to the next guy, as George Bush did with Barack Obama in 2008; the changing of the guard at the Fed, that is. Alan Greenspan oversaw the making of a stock bubble in the final phase of the great bull market ended in 2000. He then instigated a credit bubble, which launched a housing bubble, made the credit hopped consumer feel wealthy and oh yes, built unsustainable distortions into the system through diced and sliced debt derivative vehicles of all kinds.
Then in 2006 he deftly made the hand off to Ben Bernanke. Bernanke then dealt with the Maestro’s second aftermath as it began cropping up in 2007 and now, nearly 4.5 years into a cyclical bull market that has another 6 months or so to run if it is to match the two previous cycles (not a given), it is time once again for a hand off.
The poor shlep. Seriously, whether Larry Summers, Janet Yellen or some out of left field dark horse pick, the new Fed chief will probably end up with a mess to deal with. The S&P 500 is going up in lock step with the adjusted money supply that has been ramped due to QE’s bond buying and monetization.
Here is a chart from NFTRH 249 that shows this in glaring detail. Increasing 'taper' talk (let alone action) would probably not be helpful to the markets if the strong correlation holds.
spx.base
S&P 500 & Monetary Base Correlation
I believe that global Treasury bond supply/demand dynamics and not the Fed will decide when the bond purchase program will end. From NFTRH 249:
"The decisions are being made for them. Why on earth do you think they are flip flopping around in the media about ‘taper, no taper, maybe taper… dohhh!'? They are like day traders looking at a 5 minute chart. They are day trading a super critical macro economic concept."
and…
"If you believe that the Fed is not all controlling and currently enjoys the equal and opposite status to the bumblers they were perceived as in 2011, you might think that their stock has peaked, given the pressure that the bond market is starting to exert upon them.
If the Fed’s stock has peaked, what about its ability to keep the blue line spiking? If the blue line peaks, what about the maroon line? According to the chart above bulls remain Caught in a Dream: "Thought I was livin'… But you can’t never tell… What I thought was heaven… Turned out to be hell." –Michael Bruce, from Alice Cooper’s classic album Love it to Death."
So we have some 'new Fed Chairman' drama to look forward to now in a market environment that always seems to have something to fixate upon in an age of extreme obsession with policy makers. The chart says that the Fed will only be popular as long as the blue line keeps rising. It does seem as though Mr. Bernanke’s timing is just as good as that of his predecessor.
...
Enhanced by Zemanta