New York, Mar.4, trading stocks .- Darell Huff wrote in his 1954 book 'How to Lie with Statistics', "If you torture the data long enough, it will confess to anything". I am about to do just that with the Volatility Index.
The VIX indicator is one of the tools used to gauge fear. By measuring the implied volatility of the S&P 500 index options, the VIX tells us the market's expected volatility over the next 30 days. When the VIX (^VIX - News) rises, expected volatility of the S&P 500 index (^GSPC - News) rises, and when the VIX falls, expected volatility of the index also falls. Often a rise in the VIX corresponds to a fall in the S&P 500 as volatility is associated with falling markets more than rising markets.
Before the mid 2000's, the market relied on the VXO (^VXO -News), which measured volatility of the S&P 100 options (^OEX -News) to gauge fear. This indicator is still around, but less popular than the VIX which focuses on the S&P 500. The Nasdaq 100 also has its own volatility index, the VXN (^VXN - News)
Tricks with the VIX
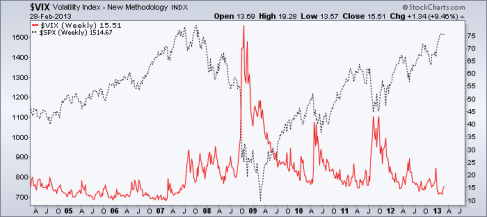
The VIX typically performs opposite of the S&P 500 and bottoms when the markets are topping and tops when the markets are bottoming. This is shown below with a standard long-term chart of the VIX index compared to the S&P 500.
But, having the VIX and the S&P inversely correlated with one bottoming while the other is topping can be confusing and counter-intuitive. Luckily we can look at the VIX differently.
The VIX Flip
One way to analyze negatively correlated assets such as the S&P (SPY - News) and VIX is to invert one of them. To do this we simply make the VIX a fraction and plot it alongside the market. The chart below provided in our ETF Technical Forecast on 02/24, just before the VIX rallied 34% on 2/25, shows that result, the flipped VIX.
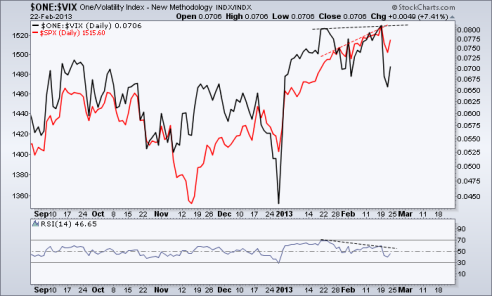
This chart now allows the VIX to move in the same direction as the S&P to better compare them apples to apples.
What is the Flipped VIX Telling Us?
The S&P is shown in red and the inverted VIX in black. It is easier to see on the second "flipped" chart how the inverse VIX tops and bottoms follow alongside the S&P's very closely.
Using these techniques, along with other technical and sentiment indicators, helped us see some great VIX buying opportunities that we outlined in an article on 2/06 (here) with the VIX below the 13 level. We reiterated on 2/10 to subscribers in our Technical Forecast to continue to hedge downside risk by buying VIX call options. "The VIX still looks to be forming a base and given our overall expectations of an eventual market decline and cheap cost of protection, in the money VIX calls remain good for hedging positions."
The VIX call options suggested more than doubled as the VIX rallied as high as 19 and still remains up over 20% from its mid-February low levels.
Currently, shown by the black dashed trendline in the "flipped" chart above, the inverse VIX was not making new highs, even though the market was. That was one sign the VIX was showing relative strength and a better candidate to hedge your portfolio.
Currently we are watching a key trendline that will keep the VIX long trade intact. We also continue to watch the flipped VIX for continued signs of relative strength. For now, VIX call options remain the prefered candidate in hedging your portfolio's downside risk.
The VIX (and inverse VIX) is another tool to have in the toolbox. Some ETFs that can be used to take advantage of short-term VIX trades are the ProShares VIX Short-Term Futures ETF (VIXY -News), the ProShares Short VIX Short-Term Futures ETF (SVXY - News), and the ProShares Ultra VIX Short-Term Futures ETF (UVXY - News). But, levered exchange-traded products have many risks associated with them which is why we prefer the purer VIX play of using options contracts.
Tools such as the inverse VIX can help us identify trends and setups that otherwise may be missed with traditional analytical tools. In the ETF Profit Strategy Newsletter and technical forecast update we examine the VIX and other asset classes in detail to identify high probability trading setups every Sunday and Wednesday night. ...
No comments:
Post a Comment