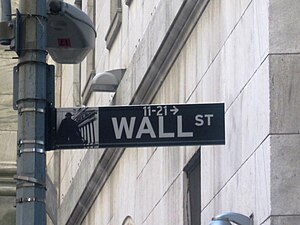
| English: Wall Street sign on Wall Street (Photo credit: Wikipedia) |
New York, Agust.5, free stocks .- What if I told you there was a way to buy a stock you knew was going to go up, and sell it before it fell?
It would be pretty great, I know. And I am sure you're thinking, "How can you know for sure a stock is going to go up?"
Well, I can't. Nobody can be 100% sure that a stock is going to go up. But I've developed a strategy you can follow today that has been proven to identify the stocks most likely to go up, as well as know which stocks in your portfolio are approaching a downturn.
Determining whether a stock is likely going to continue moving upwards can be difficult. Wall Street firms spend a fortune paying analysts to try to figure this out, but their research isn't widely available. Usually only large customers -- institutional investors, hedge funds and high net worth individuals -- have access to this research, which gives those investors a chance to sell ahead of a fall in share price.
But while you, the individual investor, can't always get Wall Street firms to share their research, you can follow what the largest investors are doing by observing the price action of individual stocks.
When hedge funds and other large investors are buying, we should see the stock outperform the market. This can be measured with an indicator known as relative strength (RS).
Relative strength quantifies how any individual stock is performing compared with all of the other stocks in the market. The actions of large investors can be seen in RS. When they are buying, the stock price should be rising faster than the rest of the market, and when they are selling, we will usually see the stock price lag the broader market. RS summarizes this buying and selling pressure in a single indicator.
Using RS to buy market leaders and avoid laggards is one of the best ways I know of beating the market.
It's such a powerful indicator, it could have told you exactly when to buy and sell Apple (Nasdaq: AAPL), for example. The RS indicator would have recommended buying Apple at a price of $460 per share in February 2012, when its RS was above 70 (I recommend stocks with an RS over 70, which means they are outperforming 70% of the market). After the purchase, we would then hold onto our shares until RS fell below 70 -- the point when Apple had fallen out of favor with larger investors and the share price reached $650.
 |
If we sold Apple at $650, we would have pocketed a tidy 41% return in just eight months. That would be well before the stock plummeted 31% to where it is today, languishing back around $450.
In other words, the RS indicator shows you the ideal time to buy a stock, rack up gains, and sell long before you lose your shirt.
Unfortunately, there is never a free lunch on Wall Street -- using RS alone is only half of the work.
While stocks with a high RS can provide better-than-average gains, some do come with a degree of risk. For example, these could be the kind of volatile stocks that suffer large declines when a company misses earnings estimates by a single penny.
To help minimize this risk, I look for high RS stocks with strong fundamentals. The main indicator I look to is cash flow growth.
In my extensive tests, I have found changes in cash flow per share growth to be a more predictive fundamental indicator than sales, earnings, dividends or any of the other metrics reported by a company.
But there's also a logical reason: Positive cash flow allows a company to invest in its future.
Both relative strength and fundamental analysis have merit in finding market-beating stocks, but what happens when we put these two methods together?
The answer is simple. By looking at relative strength and cash flow growth, you wind up with what I think is one of the single best systems for making money in the stock market.
After a great deal of research and testing, I created a trading system that does just that. I call it the "Maximum Profit" system. Its rules help us identify stocks that are likely to outperform the market during the next six months to a year with lower-than-average risk.
The results from using this method have been outstanding -- over a decade-long test, the Maximum Profit system generated a massive 571% total return.
.


No comments:
Post a Comment