"No man can become rich without himself enriching others"
Andrew Carnegie


Showing posts with label free stocks. Show all posts

Thursday, August 22, 2013

3 Reasons to Ditch Your Bear Suit

Bull and bear in front of the Frankfurt Stock ...
Bull and bear in front of the Frankfurt Stock Exchange (Photo credit: Wikipedia)
By Rude Awakening

Baltimore, Aug.21, free portfolios .- Don't give up on stocks just yet. In this market, the early bear gets squeezed.

It's just plain dangerous to bet against a low-volume drop like we're seeing right now. Heck, we're not even officially experiencing a correction. Or a meaningful dip. But that hasn't stopped the crash brigade from declaring once again that this is the beginning of the end for stocks…

"Suddenly, everyone is talking about this being a correction. I would say that at the current moment, we are just barely in a dip but possibly headed toward a correction," says Josh Brown of The Reformed Broker. "With a market pause that is not yet even a 5% dip - let alone a 10%+ correction - people (myself included) have been jumping the gun in trotting out the C-word so early."

He's not alone.

These low-volume drops have investors running in circles. There are no bulls in sight. Everyone is expecting the worst…

I'm not saying you should completely ignore this month's market action. But there's no reason to sell everything and set yourself on fire out on the front lawn…

Here are three reasons you shouldn't jump headfirst into the bear market camp just yet:

1. It's August

Trading volume is almost non-existent right now. And for the past several years, we've seen quite a few wild price swings in August that didn't stick. It's entirely possible that buyers kick it back into gear after Labor Day…

2. The Taper is coming?

Every dip in this market since the November 2012 bottom has coincided with a big policy fear. First it was the Fiscal Cliff. Then it was Sequestration. Now it's the Taper. The safe bet so far is that none of it really matters as much as people think it does.

3. Hysteria

Investors should welcome a dip. Dips are opportunity. But that's not the vibe I'm getting as the market creeps lower this month.

Bespoke Investment Group reports that bullish sentiment among newsletter writers has declined to its lowest levels since late June. This piece of data is usually a great contrarian indicator.

Also, don't ignore pockets of strength in this market. While the Dow coughed up its gains yesterday and closed in the red, the Russell 2000 finished the trading day up more than 1.5%.

It's never a good idea to trade on your fears. Keep a level head and let price guide your decisions. The dog days of summer are almost behind us…

.
Enhanced by Zemanta

The Timeless Wisdom of Izzy Stone

Stones
Stones (Photo credit: rkramer62)
By Daily Reckoning
Chicago, Aug.22, free stock tips .- "I sought in political reporting what Galsworthy in another context had called 'the significant trifle' -- the bit of dialogue, the overlooked fact, the buried observation which illuminated the realities of the situation." -- I.F. Stone, The Haunted Fifties (1963)

I start with a hidden problem in the stock market's latest earnings report card. Overall, earnings rose about 2% for the quarter. But if you take out the financials (banks, insurers), earnings actually fell by 3%.

That's a problem.

I appeared on Fox TV Friday morning. Before the show, I said I wanted to talk about this earnings stuff. The producer asked, "Do you think that's too technical to explain?"

"I should hope not" I thought to myself. I hope people understand that earnings (or profits) drive the stock market over the long term.

Specifically, the market rises and falls based on what the consensus guess is about where earnings are going. The market looks ahead. So you can match up the S&P 500 -- a broad proxy for the market -- with the consensus guess for earnings in the coming 12 months (the so-called "forward estimate").

Take a look at this chart from FactSet, which shows just that.


So if earnings fall -- or if people start to think earnings will fall -- the stock market also tends to fall. This is simple stuff. Trying to predict what will happen is, of course, anything but simple. I'd say it's foolish to even try. But people love this kind of thing -- especially TV people.

I was on Fox last week, on Aug. 7. I expressed the usual caution about the market, which I've been doing in these pages all year. Asked if it was time to sell, I said "Absolutely." I told viewers that my C&C portfolio was down to just nine names. We have historically carried 20-25.

Anecdotally, I said, that tells you what I think of the market. It was a lucky call, because the market has done nothing but drift lower since. (It got me a return invite. They want to know what I think now.)

People are starting to worry about earnings. They are also worried about when the Fed will stop pouring free drinks and end the party -- which, in a roundabout way, still comes down to a worry over earnings.

The earnings for the second quarter seem to foreshadow a decline ahead.

I've already pointed out the fact that if you exclude the banks, earnings actually fell. In some sectors, the decline was ferocious. The mining sector's profits were off 59%. (Fortunately, we put ourselves in a great position here. We long ago dumped all of our miners and commodity plays. Instead, we bought the financials. Today, we enjoy the profits -- and savings -- of that decision.) The overall growth in earnings was the third-slowest growth rate in the past four years (or 16 quarters).

Also, the number of positive surprises was the lowest since 2008. And of the number of companies that gave guidance for the third quarter, about 80% have issued negative guidance. Meaning they've taken their forecasts down a notch or two. As a result, the expected earnings growth rate for the third quarter is 4.3%, down from 6.7% at the start of the quarter. That figure is still probably optimistic.

In summary, for anyone who takes a deeper look into the market's working engine (those earnings), there are plenty of worn-out parts that look like trouble down the road.

Taking a deeper look is what Izzy Stone was all about.

I.F. Stone (1907-89), or "Izzy" as he was known, wrote and self-published a newsletter called I.F. Stone's Weekly for nearly two decades. It was influential in its time. At its height in the 1960s, Stone had about 70,000 subscribers.

His focus was political reporting. He was famous for digging through the public record and finding things that people missed. As he described it so eloquently, "I sought in political reporting what Galsworthy in another context had called 'the significant trifle'-- the bit of dialogue, the overlooked fact, the buried observation which illuminated the realities of the situation."

His work has earned him a place among the best investigative reporters that ever lived. I find him inspirational in my own efforts in trying to put together a newsletter attuned to those same "significant trifles." Stone would've made a heck of a financial newsletter writer.

Among my favorite nuggets of wise advice from Stone:

"If you're going to be a newspaperman, you are either going to be honest or consistent. If you are really doing your job as an observer... it's more important to say what you see than worry about inconsistency. If you are worried about that, you stop looking. And if you stop looking, you are not really a reporter anymore. I have no inhibitions about changing my mind."

I don't think I have to point out how this applies to markets. Certainly, if you come at the market with a strong view, you are apt to overlook the possibly important trifle that doesn't fit your worldview. And that trifle might be the clue that gets you ahead of the crowd.

More from Stone:

"The search for meaning is very satisfying, it's very pleasant, but it can be very far from the truth. You have to have the courage to call attention to what doesn't fit. Even though readers are going to say, 'Well, two weeks ago you said this.' So you did. And maybe you were wrong then, or partly wrong, but anyway, you've just seen something that doesn't fit, and it's your job to report it. Otherwise, you're just the prisoner of your own preconceptions." [Bold added.]

This is not just for newsletter writers. This is for thinking people everywhere.

We should realize that we are all, to some extent, prisoners of our preconceptions. And we should all work to not let those preconceptions blind us to opportunities (or pitfalls) staring us in the face. Aim to take opportunity (and see trouble) where it lies, and don't try to force the market to live up to your preconceptions.

Izzy's world had its center in Washington. Our focus is Wall Street. Both places have many affinities. Power and money are their chief currencies. Deception and sleight of hand are common skills. It's easy to get discouraged when you get close. Izzy never did.

"I felt that if one were able enough and had sufficient vision," he once wrote, "one could distill meaning, truth and even beauty from the swiftly flowing debris of the week's news." Stone's essays did that with wit and good writing.

If you are interested, I recommend The Best of I.F. Stone as a starter. If you want more, you can move on to Stone's six-volume A Nonconformist History of Our Times, which starts in 1939 and runs until 1970. I've also read two excellent biographies: All Governments Lie! by Myra MacPherson, and American Radical, by D.D. Guttenplan.

I live in a suburb of Washington, D.C. (If you step outside and listen closely, you can hear the beating heart of the Empire.) Last night, I headed down to the Penn Quarter to meet a couple of friends for dinner. Izzy used to write his Weekly from Washington and lived only a couple of miles from where I was.

It's unseasonably cool in Washington. We ate out on the patio at chef Jose Andres' Jaleo restaurant. (Best tapas restaurant in town.) My friends were globe-trotting investors, and I was hoping to get a useful lead or two. And I did. Never stop looking, Izzy used to say. More another time...
...
Enhanced by Zemanta

Great Company, Unstable Dividend

An assortment of United States coins, includin...
An assortment of United States coins, including quarters, dimes, nickels and pennies. (Photo credit: Wikipedia)
By Wealthy Retirement

New York, Aug.22, free stocks .- Blackstone Group L.P. (NYSE: BX) is one of the world's largest and most successful investors. It runs a diverse group of funds that invest in a wide variety of assets including stocks, real estate, private equity, etc. Blackstone has nearly a quarter of a trillion dollars under management.

The company makes a lot of money. In the first six months of the year, its profit was $938 million. That's up significantly from $512 million the year before.

And Blackstone pays a decent dividend. In the first six months of the year, it has paid $0.53 per share. Annualized, that comes out to a healthy 4.9% yield.

However, the dividend fluctuates strongly from quarter to quarter and year to year.

In the first quarter, the distribution was $0.30. The second quarter distribution fell to $0.23. So for an investor who needs a reliable income stream, Blackstone doesn't deliver.

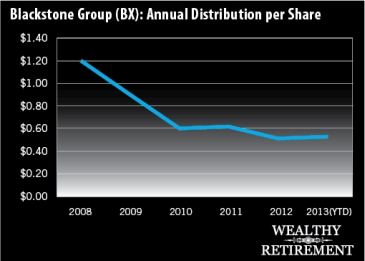
You can see from the chart below, the company's dividend history has been all over the place. It lowered the dividend in 2009 and 2010. Raised it slightly in 2011, cut it in 2012 and now will grow the dividend in 2013.


In the first six months of the year, the company's distributable earnings (a measure of cash flow) was $729 million. During that time, it paid out $905 million in distributions. Last year at this time it also had paid out more in distributions than it earned.

The company has a policy in place that the dividend will be at least $0.12 per share, even if it has to "borrow" money from future quarters to pay for it. Fortunately for shareholders, the company hasn't needed to do that yet, but it is possible it will in the future if business takes a bad turn.

When I discuss the safety of a dividend in these Safety Net columns, my main goal is to try to figure out if the dividend will be cut in the not-too-distant future. Although I always prefer dividend growth, a stable dividend will still merit a high rating.

Unfortunately for Blackstone shareholders, the dividend is anything but stable.

That doesn't mean it will get cut to zero. Blackstone is a very well-run company that makes lots of money. But it has no track record whatsoever to speak of when it comes to a stable dividend. Some years it goes up. Others it comes down by a significant amount.

Blackstone may be a suitable investment for those who are looking for growth (I haven't analyzed the stock for its growth prospects) and who will be happy with whatever income they happen to get.

Other investors who see that 4.9% yield and are willing to take their chances that the dividend doesn't get reduced too much in the future could wind up happy too. I'm not saying they will, just that it's a possibility.

But since this column is all about safety, I have to warn investors who need a reliable quarterly dividend check that Blackstone is NOT for you. Its dividend is just way too unpredictable. You never know what you're going to get in any given year.

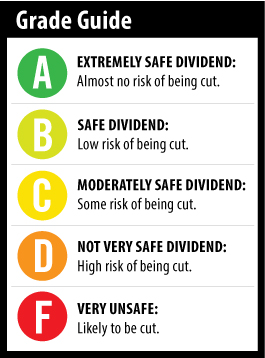
Dividend Safety Rating: F

If you'd like me to review the dividend safety of one of your stocks, leave the ticker symbol in the comments section below. But before you do, check to see if I've written about it already. Enter the ticker symbol or name of the company in the search box in the upper right corner of the website.

Enhanced by Zemanta

Monday, August 12, 2013

S&P 500 healthy up-trend

By Colin Twiggs

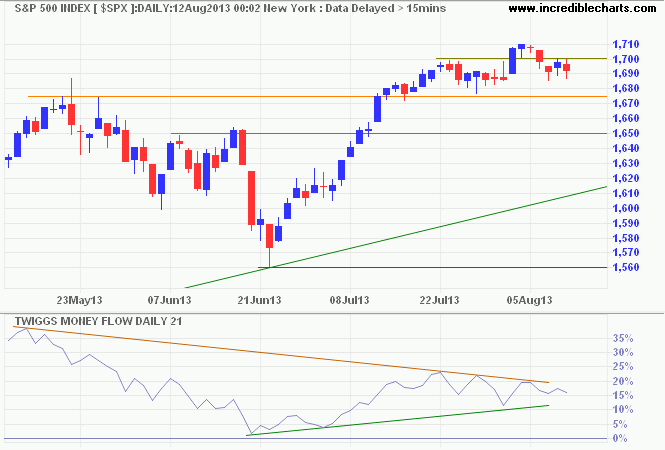
Sydney, Aug.12, free stocks .- The S&P 500 is again testing resistance at 1700 after a short retracement. Bearish divergence on 21-day Twiggs Money Flow continues to warn of selling pressure, but breakout above 1700 would signal an advance to 1800*. Reversal below 1675 would test support at 1650.
S&P 500
* Target calculation: 1680 + ( 1680 - 1560 ) = 1800
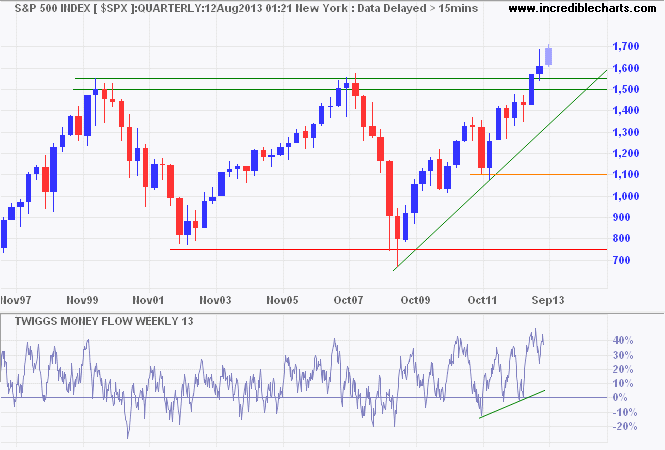
But the primary up-trend shown on the quarterly chart is healthy and, while correction to the rising trendline would be reasonable, trend reversal is unlikely.
S&P 500
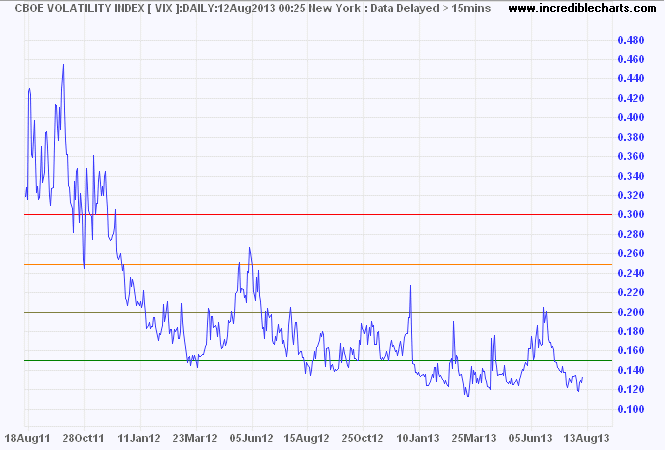
The VIX below 15 indicates low market risk.
VIX Index
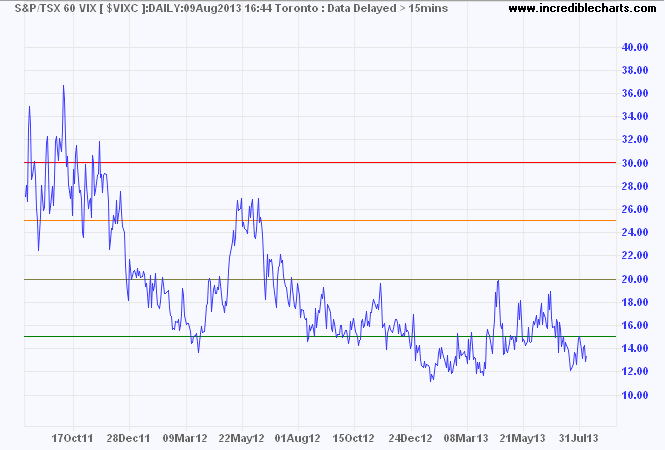
Canada's TSX 60 VIX is similarly bullish.
TSX 60 VIX
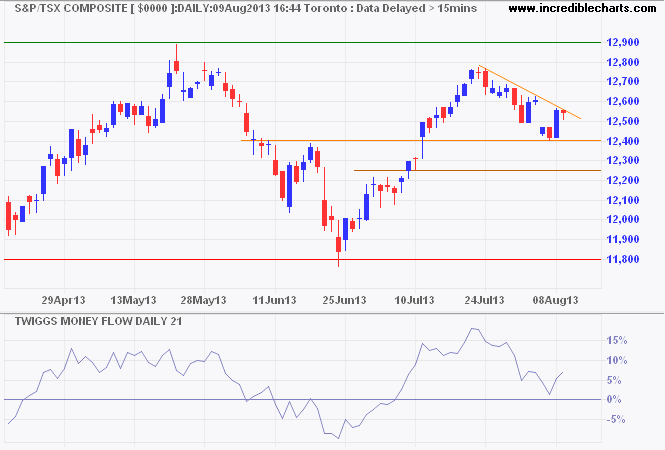
The TSX Composite Index is testing support at 12400. Penetration of the declining trendline would indicate the correction is over and advance to 12900/13000 likely. A 21-day Twiggs Money Flow trough above zero would suggest a healthy up-trend. Breach of support remains as likely, however, and would test 12250. In the long-term, breakout above 12900/13000 would offer a long-term target of 14000*.
TSX Composite Index
* Target calculation: 13000 + ( 13000 - 12000 ) = 14000 ...
Enhanced by Zemanta

How to define risk in dividend paying stocks?

The Coca-Cola logo is an example of a widely-r...
The Coca-Cola logo is an example of a widely-recognized trademark representing a global brand. (Photo credit: Wikipedia)
By Valueinvestingnews

Boston, Aug.12, free stock tips .- For many equity investors these days, risk is usually defined as an unfavorable fluctuation in stock prices. This means that an investor who purchased Coca-Cola (KO) at $40/share, and observes the price decline to $30/share, had a $10 unfavorable move in the price against them. This view on risk could be adequate for investors whose investing timeframe is in days or months. The problem with defining risk with stock market volatility however, does not make much sense for long-term investors.

As a long-term investor, I focus on identifying companies with strong fundamentals, and good business prospects, which I then try to accumulate at attractive valuations. I then monitor long-term business trends, read annual reports, and check to see if the company is earning more and paying out more in dividends. As a result, the data points I use are in “years”, rather than days or months. If you expect to hold a company for 20 years, focusing on a decrease from $40 to $30 is relatively immaterial. In my investing, I usually avoid focusing on price fluctuations, except as a tool to uncover cheap stocks to buy. Of course, if this drop is because of some material information that could affect the long-term prospects of the business, you need to evaluate whether you want to add or liquidate your position. However, if this drop is because stock prices are simply going down in tandem, chances are that you are not getting much from this information.

For me, risk is defined as a situation where I lose my all of investment capital. When I lose my investment capital, I would be unable to make more investments and earn more money from it. This permanent loss of capital is usually associated with situations such as business failure from the company I invested in. This would mean that not only would I lose out on a portion of my dividend income, but would also be unable to replace it because the capital base has dwindled significantly. This is why it is important to diversify my investments, in order to reduce the impact on my capital base from the effects of one company failing. If the stock I own merely goes from $40 to $30, but the fundamentals are unchanged I would not see that as a risk, but rather as the cost of doing business. Therefore, deteriorating fundamentals are a much larger risk to your capital and dividends than stock price fluctuations alone.

I believe that prices are what you pay, but value is what you get. Over the next 20 - 30 years that you hold dividend paying stocks, you will likely suffer big declines in stock prices on several occasions. This could be due to a lot of factors like recessions, wars, oil shocks, as well as a lot of company specific factors. The goal is to start with the facts first, such as a news release or an annual report for example, rather than focus on prices alone, and avoid making decision on rumors and opinions which are not grounded by facts. It is also important to be mentally prepared for declines in prices, and not panic and do something stupid like selling everything.

I would consider selling only after a dividend cut, in order to avoid acting on noise. The reason behind this rule is two-fold. The first reason is that companies do not grow to the sky in a straight-line. There are roadblocks along the way. At the time these roadblocks occur, it is very difficult to evaluate if they will result in a permanent loss or not. When Johnson & Johnson (JNJ) had issues in one of its subsidiaries in 2010, many investors feared the worst. Since then however, the company has managed to clean up operations, and succeeded. If you had sold back then, you would have missed out on the opportunity. As a result, any negative news might be scary at the time, but in the grand scheme of things, could be simply considered noise. This is why I note these negative events, but might refrain from selling off my position. I have also sold when I found valuation to be too high, but I have had mixed results from this scenario.

Second, in my analysis of companies, I have noted that when a company cuts dividends after it has paid and increased them for decades, it is usually admitting trouble. However, there is more trouble ahead, because boards typically make their decisions on whether to increase or cut distributions based on the business prospects for the next 2 – 3 years. In the Johnson & Johnson case above, the company was experiencing some issues, however they kept raising the dividend and kept earning more per share. This indicated that the problems are not as huge as expected.

Of course, selling after a dividend cut is not effective 100% of the time. However, it is a fail-safe mechanism, that can allow an investor to have a reasonable confidence that selling at this event will leave them with some capital. This capital can then be deployed in other attractive opportunities that will generate rising streams of income. In addition, selling after a cut removes any guesswork of whether the negative events you are learning about the company are noise or not. It should also be a wake-up call for the investor who “falls in love” with a company, and could expect to rationalize themselves out of selling a company with deteriorating fundamentals.

In conclusion, I define risk in dividend investing as an event that leads to total destruction of capital, from which my dividend income would be reduces or eliminated. In order to reduce this risk, I am diversifying my portfolio, and have a hard sell rule of disposing of a stock after a dividend cut. This would protect my dividend income, and allow me to enjoy the fruits of my labor in my golden years.

...
Enhanced by Zemanta

Urgent: This Currency Could Be Crashing As We Speak...

Self-employed
Self-employed (Photo credits: www.myhardhatstickers.com)
By StreetAuthority

Washington, Aug.12, free portfolios .- Lately, every day it seems like some Wall Street expert or financial commentator has a dire prediction about the U.S. economy and the dollar.
But I'm tracking what I believe is a much more urgent currency crisis...

The economic news out of Australia seems to get worse by the week.

Now, economic commentators especially like to warn of China's imminent collapse. So, early last week, when China's newest trade numbers came in shockingly weak, the talking heads had a field day with the news. So, what does this have to do with Australia?

Well, resource-rich Australia is particularly vulnerable to any slowdown in China, because a whopping 45% of the country's exports go to China. China is Australia's No. 1 trading partner.

And China just isn't buying as much of Australia's natural resources as it once bought.

Iron ore is Australia's No. 1 export, and China just isn't buying as much as it used to. That may explain why iron ore spot prices plunged 30% between February and May of this year.

But its problems aren't in the past. Like I said, the economic news out of Australia seems to get worse by the week.

Forget China: Watch Australia for Economic Collapse
The Australian government admitted that its budget deficit is going to balloon to $30 billion this year.

Now... $30 billion may not sound like a lot, especially in comparison to the United States -- which has been running TRILLION-dollar deficits since Obama took over. But Australia is a much smaller economy, with a 2013 national budget of A$398 billion.

On a percentage basis, $30 billion works out to roughly an 8% deficit. Worse yet, the 2013 deficit was anticipated to be only $18 billion just a few months ago.

The problem is an unexpected and rapid $33 billion drop in tax revenue caused by a slowdown in trade with China, and tumbling commodity prices.

"We are now facing a deteriorating economy when the rest of the world is actually getting better," Treasury Secretary candidate Joe Hockey said.

And Shane Oliver, the chief economist of AMP Ltd., one of the largest brokerage firms in Australia, publicly described the Australian economy: "I'm shocked by how much it has deteriorated."

Falling Growth Forecasts, Interest Rates
Even the eager-to-be-re-elected politicians are admitting there is a problem, as last week they cut their 2013 GDP growth forecast from 2.75% (which was made in May) to 2.5% and warned that unemployment would rise from 5.75% to 6.25% this year.

Last week, the Reserve Bank of Australia also cut benchmark interest rates to a record-low 2.5%, with the central bank citing weaker commodity prices and slower growth as the primary drivers behind the decision.

In addition to taking action to prevent economic collapse, Australia is also making a move to prevent a banking collapse by levying some deposits.

Tax The Rich! (Yeah, That Will Work...)
Australian politicians are stealing a page from U.S. politicians and looking to fund their budgetary problems by taking money from those evil corporations and you-didn't-build-it wealthy individuals.

Australia plans to levy a new 0.05% tax on bank deposits up to A$250,000, which could generate A$733 million in an 18-month span.

Unlike the government of Cyprus which taxed (penalized) the depositors, Australia is going to tax the banks instead. Of course, Australian banks will, in turn, pass on the cost of this tax to consumers in the form of higher fees or lower interest rates.

It is bad enough when governments raise taxes on our investment income, but I am hard-pressed to think of a worse way to discourage growth than to tax people's capital.

Bottom line: Australia is an economic train wreck waiting to happen. And you'll want to be on board when it derails.

I have filmed a short video (10 minutes) in which I further explain how the Aussie dollar crash will unfold -- and reveal an easy way to play the coming crash for a quick 20%-plus gain. Click here to watch it now.

...

Enhanced by Zemanta

Monday, August 5, 2013

How To Be Smart In A World Of Dumb Investors

English: Wall Street sign on Wall Street
English: Wall Street sign on Wall Street (Photo credit: Wikipedia)
By StreetAuthority

New York, Agust.5, free stocks .- What if I told you there was a way to buy a stock you knew was going to go up, and sell it before it fell?

It would be pretty great, I know. And I am sure you're thinking, "How can you know for sure a stock is going to go up?"

Well, I can't. Nobody can be 100% sure that a stock is going to go up. But I've developed a strategy you can follow today that has been proven to identify the stocks most likely to go up, as well as know which stocks in your portfolio are approaching a downturn.

Determining whether a stock is likely going to continue moving upwards can be difficult. Wall Street firms spend a fortune paying analysts to try to figure this out, but their research isn't widely available. Usually only large customers -- institutional investors, hedge funds and high net worth individuals -- have access to this research, which gives those investors a chance to sell ahead of a fall in share price.

But while you, the individual investor, can't always get Wall Street firms to share their research, you can follow what the largest investors are doing by observing the price action of individual stocks.


When hedge funds and other large investors are buying, we should see the stock outperform the market. This can be measured with an indicator known as relative strength (RS).


Relative strength quantifies how any individual stock is performing compared with all of the other stocks in the market. The actions of large investors can be seen in RS. When they are buying, the stock price should be rising faster than the rest of the market, and when they are selling, we will usually see the stock price lag the broader market. RS summarizes this buying and selling pressure in a single indicator.

Using RS to buy market leaders and avoid laggards is one of the best ways I know of beating the market.

It's such a powerful indicator, it could have told you exactly when to buy and sell Apple (Nasdaq: AAPL), for example. The RS indicator would have recommended buying Apple at a price of $460 per share in February 2012, when its RS was above 70 (I recommend stocks with an RS over 70, which means they are outperforming 70% of the market). After the purchase, we would then hold onto our shares until RS fell below 70 -- the point when Apple had fallen out of favor with larger investors and the share price reached $650.


If we sold Apple at $650, we would have pocketed a tidy 41% return in just eight months. That would be well before the stock plummeted 31% to where it is today, languishing back around $450.

In other words, the RS indicator shows you the ideal time to buy a stock, rack up gains, and sell long before you lose your shirt.

Unfortunately, there is never a free lunch on Wall Street -- using RS alone is only half of the work.

While stocks with a high RS can provide better-than-average gains, some do come with a degree of risk. For example, these could be the kind of volatile stocks that suffer large declines when a company misses earnings estimates by a single penny.

To help minimize this risk, I look for high RS stocks with strong fundamentals. The main indicator I look to is cash flow growth.

In my extensive tests, I have found changes in cash flow per share growth to be a more predictive fundamental indicator than sales, earnings, dividends or any of the other metrics reported by a company.

But there's also a logical reason: Positive cash flow allows a company to invest in its future.

Both relative strength and fundamental analysis have merit in finding market-beating stocks, but what happens when we put these two methods together?

The answer is simple. By looking at relative strength and cash flow growth, you wind up with what I think is one of the single best systems for making money in the stock market.

After a great deal of research and testing, I created a trading system that does just that. I call it the "Maximum Profit" system. Its rules help us identify stocks that are likely to outperform the market during the next six months to a year with lower-than-average risk.

The results from using this method have been outstanding -- over a decade-long test, the Maximum Profit system generated a massive 571% total return.

.
Enhanced by Zemanta

Thursday, August 1, 2013

The Bears Get a Few Minutes Out of the Cage

An einem Sonntag im August...
(Photo credit: Concentrated Passion)
By InvestorPlace

S&P 500 fails to hit 1,700; telecoms among the weakest performers

New York, Aug.1, free stock tips .- Welcome to a fresh month, the eighth month of the year: snoozy ol’ August.
To be clear, when I say “snoozy,” I don’t mean uneventful, but rather “choppy in wide ranges, on lower volume.”
Before analyzing yesterday’s dump into the close, here are the (rough) numbers for the month of July:
S&P 500: +5%
Russell 2000: +7%
Nasdaq-100: +6.5%
In other words, the bulls remained large and in charge, while the bears were forced to endure yet another month of torture. Yes, to have six up-months out of seven seems silly, and to expect another as we slide into August seems almost greedy … but that’s what traders have to deal with.
Yesterday’s morning missile was titled “The Best Thing to Do Today Is Probably Nothing,” and for those only looking at daily closes on the charts, that may well have been the best course of action. Dig a mere inch below the surface, however, and we find bearish candles/closes on most major stock indices and sectors.
Just as the S&P 500 sneaked up on the 1700 mark, algorithms put the gears in reverse in the last hour of trading and took down the index more than 10 points, or 0.7%, into the close for a marginal overall decline. On the daily chart below, note that the result of this was a bearish candle called a “shooting star,” which is denoted by the long tail above its small body.
The way to understand all of this is to realize that the bulls desperately tried to push the S&P 500 above the 1700 mark, but failed to do so and let the quick bears take over for an hour.
Also, note the negative divergence we are now seeing on the S&P 500 between price (higher) and momentum, as represented by the MACD (lower).
Remember, it’s still a big week ahead, with today’s European Central Bank and Bank of England interest-rate announcements and Friday’s July jobs report looming large. However, Wednesday’s close in U.S. equities on the back of an FOMC announcement raises a second red flag, and I have thus further tightened my long exposure in the portfolio (i.e., sold more long positions).
Yesterday’s underperformers were the utilities and the telecommunications stocks. The latter group — represented by the iShares U.S. Telecommunications ETF (IYZ) on the chart below — slid 0.64% on the day and stopped just short of falling into its large up-gap from July 15.
Given the price action of recent days, the telecom group could well accelerate this slide and move toward the $27 level for a close of said gap. ...
Enhanced by Zemanta

Gold consolidates as dollar and commodities fall

By Colin Twiggs

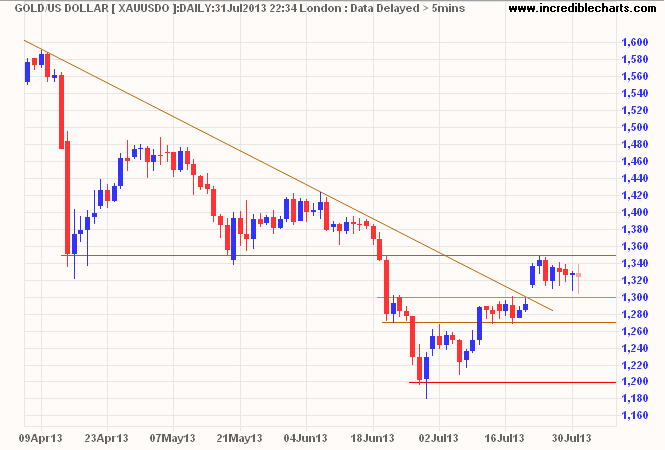
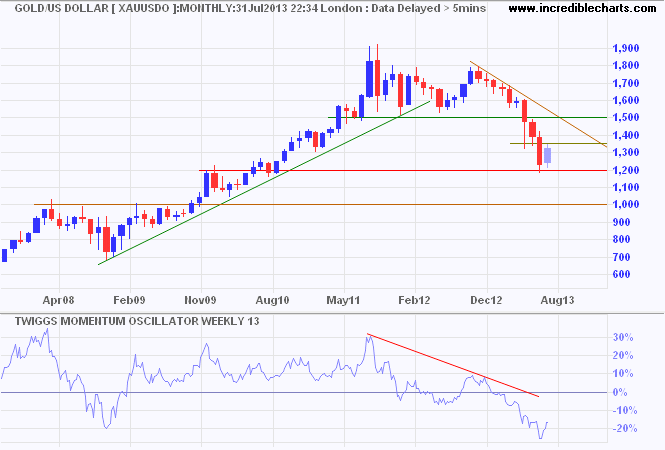
Sydney, Aug.1, free portfolios .- Gold is consolidating in a narrow range between $1300 and $1350/ounce. Penetration of the descending trendline indicates that a bottom is forming. Reversal below $1300 would suggest another test of primary support at $1200, but breakout above $1350 is as likely and would target $1400.


Gold
A rally to $1400 would test the long-term descending trendline as shown on the monthly chart.
Gold
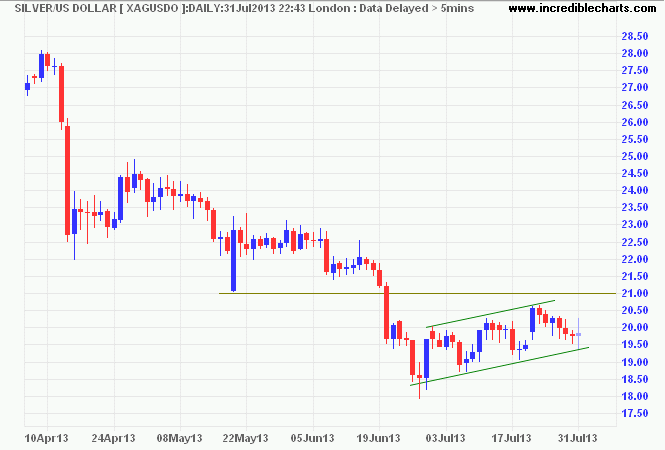
Spot silver made a weaker rally over the last month and breakout below the rising flag would warn of another decline, with a target of $16.50*. Declining silver would be a bearish sign for gold.
Silver
* Target calculation: 19.5 - ( 21.5 - 18.5 ) = 16.5

Dollar Index

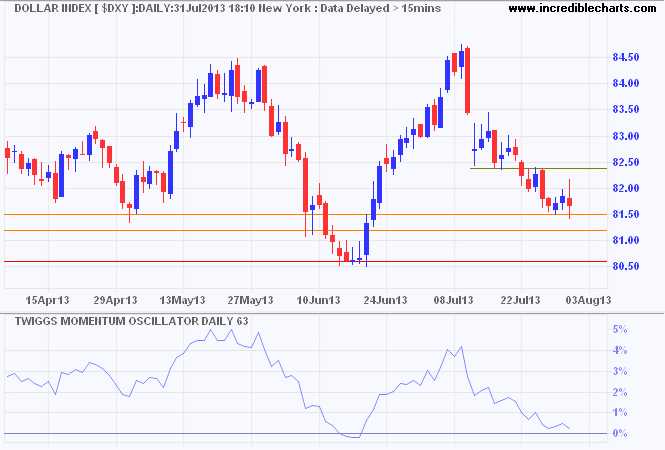
The Dollar Index found short-term support at 81.50. Penetration would indicate a test of primary support at 80.50. Recovery above 82.50 is unlikely, but would suggest the correction is over. Another 13-week Twiggs Momentum trough above zero would indicate the primary up-trend is intact. Breakout above 84.50 is some way off, but would signal an advance to the 2009/2010 highs around 90.00.
Dollar Index
* Target calculation: 84 + ( 84 - 79 ) = 89

Crude Oil

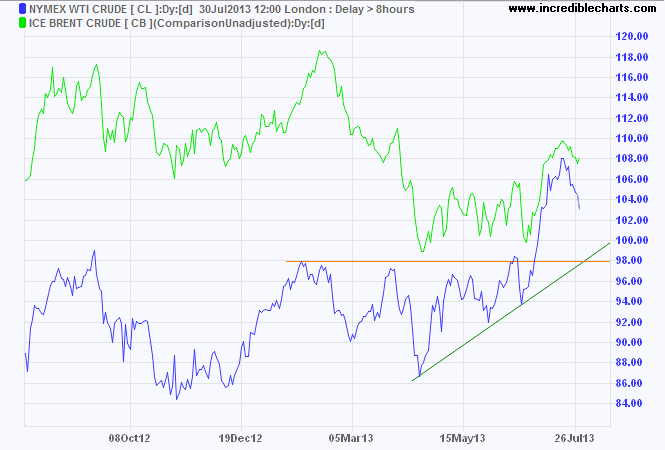
Nymex WTI light crude is retracing after a sharp rally and is likely to find support between $98 and $100/barrel. Expect the spread with Brent crude to narrow as the US recovery outstrips Europe.
Crude Oil
* Target calculation: 98 + ( 98 - 86 ) = 110

Commodities

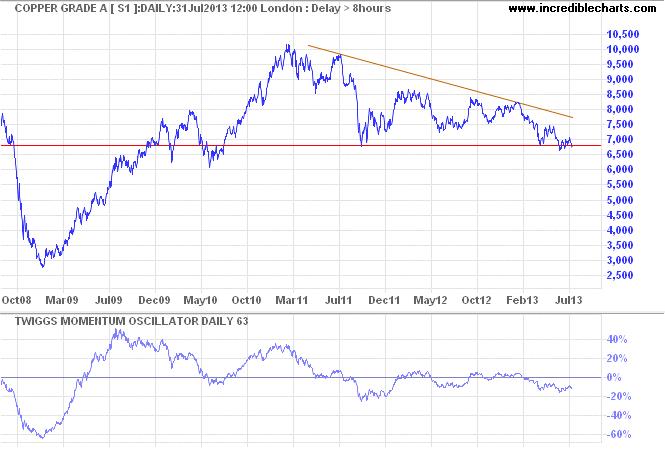
Copper is testing long-term support at $6800/ton. Follow-through below $6700 would confirm another primary decline.
Copper
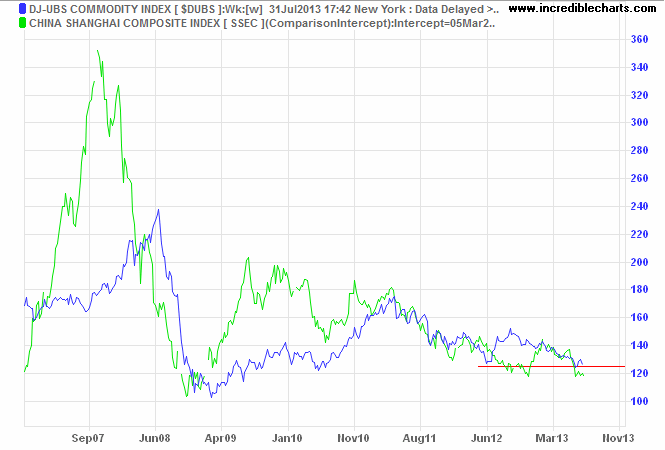
Commodity prices are primarily driven by Chinese demand. With the Shanghai Composite Index testing its 2012 low (1950), breakout would signal a decline to its 2008 low (1660) and drag commodity prices lower. Dow Jones-UBS Commodity Index breach of long-term support at 125/126 would confirm, targeting its 2009 low at 100*. Not good news for Australian resources stocks, even if the impact is cushioned by a falling Aussie Dollar.
Dow Jones-UBS Commodity Index
* Target calculation: 125 - ( 150 - 125 ) = 100 ...
Enhanced by Zemanta

Wednesday, July 24, 2013

Consider Closing Long Positions If This Happens

TAROM ATR 42-500 interior
TAROM ATR 42-500 interior (Photo credit: Wikipedia)
By InvestorPlace

While not all-out bearish yet, I will likely exit my longs when volatility picks up
New York, Jul.24, free stocks .- Tuesday was another lackluster trading day for U.S. equity indices, as the S&P 500 traded in a range of roughly 8 points. That is rather boring compared to the intra-day swings of more than 20 points that we witnessed just one month ago.


Today’s chart of the S&P 500 benchmark index shows the so-called average true range (ATR), which simply put, measures the index’s daily trading range.
During the month of June, the ATR steadily rose toward a June 24 peak of around 24 points per day. But the rally off the June lows has again caused the ATR to collapse by about 50%.
While rallies do tend to come on less intra-day volatility, what’s notable is that the duration of the rally and decline in the ATR is now once again at a point where a mean-reversion move in price (lower) of whatever magnitude should not be far away.
Also important to point out is that typically an uptick in the ATR precedes a decline in prices. As such, while I still have a couple of long positions on the books, I will likely close those upon the arrival of more volatility.
The technology space, as measured by PowerShares QQQ (QQQ), has flashed notable negative divergence versus the S&P 500, as measured by SPDR S&P 500 (SPY), as well as the Russell 2000, as measured by the iShares Russell 2000 (IWM). I discussed this on Monday, and in the chart above you can compare the three index ETFs.
Far be it from me to declare the large-cap technology group to be a brilliant leading indicator for the broader market, but since this divergence has now been under way for close to one full trading week, I would be remiss not to at least point it out.
Since the rally off the June lows, I haven’t witnessed a day where afternoon weakness in the broader market was noteworthy. While Tuesday’s afternoon slip wasn’t anything grand either, we did close at the lows of the day.
Furthermore, as trading kicked off Tuesday morning, my screens giggled in green. This didn’t last long, though, and by mid-morning, 80% of my watch list was red, which in turn led to bearish reversals on single-name stocks such as MGM Resorts (MGM), just to name one.
All in all, Tuesday’s price action, while lacking energy, did have a subtle tone of bearishness to it. However, this is not a reason to get all-out bearish on the market yet. Price action still has a lot to prove.
...
Enhanced by Zemanta