"No man can become rich without himself enriching others"
Andrew Carnegie


Showing posts with label national stock exchange. Show all posts

Thursday, August 22, 2013

The Bear Market Isn’t Here Yet, But…

New York Stock Exchange
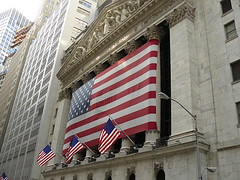
New York Stock Exchange (Photo credit: Mike_fleming)
Resistance will prove tough to overcome and risk is incredibly high


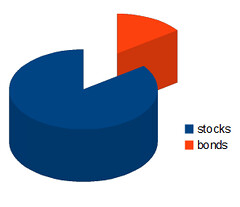
Bonds fell in reaction to the notes, as did stocks, mainly because the injection of cash into the financial system appears to have had only a small impact on jobs growth.
The report said, “Nonetheless, the unemployment rate remained elevated, and the continuing low readings on the participation rate and the employment-to-population ratio, together with a high incidence of workers being employed part time for economic reasons, were generally seen as indicating that overall labor market conditions remained weak.”
At Wednesday’s close, the Dow Jones Industrial Average was off 105 points at 14,898, the S&P 500 fell 10 points to 1,643, and the Nasdaq lost 14 points at 3,600. The NYSE traded 657 million shares and the Nasdaq crossed 359 million. Decliners outpaced advancers on the NYSE by 2.8- to-1 and on the Nasdaq by 2.1-to-1.
Chart Key
The New York Stock Exchange Composite Index contains generally higher-quality stocks. But like the other higher-quality indices, the Dow 30 and the S&P 500, it too has failed to find support at the crucial 50-day moving average mark. Its next support is at the intermediate support line at around 9,200. MACD is on a sell signal.
The Dow Jones Industrial Average broke its 50-day moving average, as well as its intermediate support line five sessions ago. Wednesday’s late sell-off puts the index in line for a serious attack on the support line at 14,845, its breakout point in August. A failure to hold that line would put the 200-day moving average in its sight — and threaten the long-term bull market.
Conclusion: Technically, the better-quality stocks are facing a battery of resistance that should stymie short-term rallies. When each support line is broken, that line then becomes a resistance line — a place which has proven to be where sellers lurk. In addition, the overall configuration of the Dow is taking on the form of a broad topping process that would be complete with a close under 14,845.
In his recent Street Smart Report, Sy Harding referred to another excellent technician, Mark Hulbert, who sees three signs of a market top:
First, the S&P 500 is up 23% in the last 12 months. Most bull markets top at over 21%.
Next, one of the most striking patterns about the month leading to a top is that the “riskiest stocks far outperform conservative ones.” We’ve discussed that at length in this column.
Finally, he mentions Warren Buffett’s favorite measure of market valuation — market capitalization versus GDP. In July, it reached 118%. The last times it went over 100% were in 1999 and 2007.
I, like Sy, don’t believe that we are beginning a bear market, although as he puts it, “But the risk is as high as in 2000 and 2007.” Ouch!
Enhanced by Zemanta

Global selling pressure

By Colin Twiggs

Sydney, Aug.22, investment opportunities .- The S&P 500 Index broke medium-term support at 1650 and is headed for a test of the rising trendline. Respect would indicate the primary up-trend is intact, but bearish divergence on 13-week Twiggs Money Flow warns of selling pressure. This is also evidenced by the marginal new high in August. A test of primary support at 1560 is likely. Breach would offer a target of 1400*.


S&P 500 Index
* Target calculation: 1550 - ( 1700 - 1550 ) = 1400
Dow Jones Europe Index also displays marginal new highs in May and August. Penetration of the rising trendline indicates the up-trend is losing momentum — also indicated by bearish divergence on 13-week Twiggs Momentum. Reversal below support at 290 would strengthen the warning, but only failure of support at 270 would signal a trend reversal.
Dow Jones Europe Index
China's Shanghai Composite Index ran into strong resistance at 2100. Declining 13-week Twiggs Money Flow (below zero) warns of selling pressure. Reversal below 2050 would indicate another test of primary support at 1950, suggesting a decline to 1800*. Breakout above 2200 and the descending trendline is unlikely, but would signal that a bottom has formed.
Shanghai Composite Index
Japan's Nikkei 225 broke medium-term support at 13500. Follow-through below 13250 would indicate a correction to primary support at 12500. Penetration of the rising trendline suggests that the primary up-trend is losing momentum. Earlier bearish divergence on 13-week Twiggs Money Flow also warns of a reversal. Recovery above the declining trendline is less likely, but would indicate the correction has ended.
Nikkei 225 index
India's Sensex broke primary support at 18500, following through below 18000 to remove any doubt. The primary trend has reversed after a triple top and now offers a target of 16500*. Declining 13-week Twiggs Money Flow confirms selling pressure. Recovery above 18500 is unlikely, but would warn of a bear trap.
Sensex
* Target calculation: 18500 - ( 20500 - 18500 ) = 16500
The ASX 200 is consolidating in a broadening top around the 2010/2011 high of 5000. Correction to 4900 would be quite acceptable, garnering support for an advance to the upper border, but breach of 4900 would indicate a failed swing, warning of reversal to a primary down-trend. Failure of primary support at 4650 would confirm. Bearish divergence on 13-week Twiggs Money Flow indicates selling pressure; strengthened if the indicator reverses below zero. Respect of support at 5000 is less likely, despite the long tail on today's candle, but would offer a target of 5300*.
ASX 200
* Target calculation: 5150 + ( 5150 - 5000 ) = 5300 ...
Enhanced by Zemanta

Fed Tapering: Misunderstood

English: Detail from Government. Mural by Elih...
English: Detail from Government. Mural by Elihu Vedder. Lobby to Main Reading Room, Library of Congress Thomas Jefferson Building, Washington, D.C.  (Photo credit: Wikipedia)
By Logic Fund Management


New York, Aug.22, hot stocks .- Today, we got a look at what the Fed was discussing at their July 31 FOMC meeting.

Again, it was another highly anticipated event for global markets.

Despite the lack of any material new news in recent weeks, the word taper has continued to dominate the headlines.

But I’m not sure why people are so fearful of the possibility that the Fed could scale down its third round of QE.

Now, I could do a deep-dive into today's Fed minutes for you, but admittedly, all of this hyper-analysis of the nuances and details of a Fed tapering is a bit ridiculous. What is being lost on everyone is what the Fed attempts to accomplish by its QE program.

To be sure, exactly how the transmission of QE helps the economy is inexact at best -- short of the downward pressure it's put on mortgage rates, from the Fed's MBS purchases. Even the Fed's Yellen, a proponent of QE and possible next Fed Chairman, has publicly said she can't prove it works directly to produce growth and drive inflation.

So what does QE do, ultimately? Here's what it does ...

It gives people the confidence, in a fragile world, that the Fed is still here, doing anything and everything necessary to defend against shocks and promote some stability. With that, people don't sit on their money. They don't hoard gold, and guns, and build a bunker. They live life. They start to invest again, and spend again.

Companies can plan. They can slowly begin to hire again. And that's what has happened.

As I've said in the past, this "confidence manipulation" strategy is key for the Fed. They don't have the policy tools (or latitude) to restructure global trade, the major structural issue that continues to overhang the global economy. But what they can control is confidence.

All of that said, the Fed appears to have realized that QE is just one of many tools that can accomplish that goal of producing confidence and stability. The ECB has shown them that making bold promises can achieve the same objective (i.e. just words). The ECB promised to keep their risky sovereign bond markets in check by threatening to buy as many shaky Spanish and Italian bonds as necessary to push rates back down to tolerable levels – enough said. They haven’t had to buy one single Spanish or Italian bond. Rates on those bonds have gone from ticking time bombs to attractive investments for global bond managers.

The bottom line: Global central banks have come to the conclusion that telling people you are constantly prepared to act, ready do anything necessary – meanwhile, telling them that rates will stay at record lows for a LONG time, can do the trick.

It makes the Fed wonder, why are we engaging the potential risks associated with QE, when it doesn't seem so necessary anymore?

From an investor’s perspective, the most important thing to keep in mind is this: The Fed and other global central banks have committed trillions of dollars to keep the world from spiraling into depression. They've continued to act all along the way (together) to promote stability in a fragile time. The last thing the Fed would do is anything to undo global economic stability, or anything to threaten the trillions of dollars in global central bank backstops.

Now, the biggest fear that has been expressed by market participants, surrounding Fed tapering of QE, has been the prospects that tapering will trigger a collapse in stocks. That's an outcome that would defeat the Fed's objectives, and it would be self-induced. Don't count on it. The Fed needs stocks higher and housing higher to fuel consumption.

For those that have been in the stock market collapse paranoia camp, consider this: Despite the many months of taper speculation, stocks are just 4% off of all-time record highs. And a September taper, while far from assured, is well priced into the market psyche.
...

Enhanced by Zemanta

Tuesday, August 13, 2013

Debunking the Myth of Free-Market American Health Care

singapore
singapore (Photo credit: Kenny Teo (zoompict))
By Daily Reckoning


Washington, Aug.13, national stock exchange .- Pascal-Emmanuel Gobry [a senior research analyst for Business Insider] posted a stimulating comparison between the American and French health-care systems. "From my outlook," he writes, "there's something that I haven't seen discussed and yet seems striking to me: how similar the French and U.S. healthcare systems are. On its face, this seems like a preposterous notion: whenever the two are mentioned together, it's to say that they're polar opposites."

Indeed, there are a lot of misconceptions about how America's health-care system compares to those of the other developed countries, including France. Both liberals and conservatives believe that the American system is a "free-market" or "capitalistic" one, and that European systems providing universal coverage are "socialized." In this article, I'll explain where both of these conceptions go wrong.

In reality, per-capita state-sponsored health expenditures in the United States are the fourth-highest in the world, only below Norway, Holland, and Luxembourg. And this is before our new health law kicks in:


In 2010, according to these statistics, which come mostly from the OECD, U.S. government entities spent $3,967 per person on health care, compared to $3,061 per person in France. Note that these stats are for government expenditures; they exclude private-sector health spending.

If anything, the U.S. figures understate government health spending, because they exclude the $300 billion a year we "spend" through the tax code by making the purchase of employer-sponsored health insurance tax-exempt.

So: if we measure the relative freedom of health-care systems by the dollar amount of government involvement in health spending, the French system is actually meaningfully freer than America's.

There are, of course, other important things to consider in terms of health-care freedom: do individuals have freedom to choose their own doctor, their own insurance, their own treatments, etc. On these bases, countries like the United Kingdom would fare very poorly. But very few people appreciate that the American government spends far more on health care than nearly every other country.

The thing to remember in America is that we have single-payer health care for the elderly and for the poor: the two costliest groups. In addition, the relatively healthy middle class has heavily-subsidized private health insurance, in which few individuals have the freedom to choose the insurance plan they receive. Neither of these facts commend the American health-care system to devotees of the free market.

One of the most frequently-made arguments in favor of socialized medicine is that it saves money, relative to the American system. And it is true that Europeans et al. spend less per-capita, and as a percentage of GDP, than we do.

But the pro-socialism argument has a glaring weakness: it ignores the two most significant examples of market-oriented universal coverage in the developed world, Switzerland and Singapore, where state health spending is far lower than it is in other industrialized nations. Neither Switzerland nor Singapore could be described as libertarian utopias -- both systems contain aspects that conservatives wouldn't like -- but they provide powerful examples of how market-oriented health care systems are more cost-efficient than socialized ones.

I've described Switzerland as having the world's best health-care system. In Switzerland, there are no government-run insurance plans, no "public options." Instead, the Swiss get subsidies, much like "premium support" proposals for Medicare reform or the PPACA exchanges, from which Swiss citizens buy health care from private insurers. The subsidies are scaled up or down based on income: poorer people get large subsidies; middle-income earners get small subsidies; upper-income earners get nothing.

The OECD puts Switzerland high on the league tables in terms of government health spending, but that is due to a statistical anomaly. Switzerland has an individual mandate; the OECD defines state health expenditures to include insurance premiums that the government requires individuals to pay, even if that spending is on private insurance. That is a debatable approach from the OECD, because the spending goes directly to the insurers, without the government as a redistributor. If you adjust for this anomaly, Swiss state health spending is $1,628 per person (which accounts for the taxpayer-financed premium support subsidies).

The premium support system allows the Swiss to shop for their own insurance plans, which gives them the opportunity to shop for value -- something that almost no Americans do. As a result, about half of the Swiss have consumer-driven health plans, combining high-deductible insurance with health savings accounts for routine expenditures.

The other important market-oriented counterexample is Singapore. Singapore has, arguably, the most market-oriented system in the world. Singapore's GDP per capita is about 20 percent higher than America's, with comparable (if not higher) health outcomes, and spends an absurdly low amount on health care relative to the West. How do they do it?

The key to the Singapore system is mandatory health savings accounts: again, something that libertarians and many conservatives wouldn't like. Matt Miller of the Center for American Progress describes Singapore as "further to the left and further to the right" than the American system -- something that could also be said of Switzerland.

In a manner somewhat like our Social Security system, Singapore takes mandatory deductions from workers' paychecks -- around 20 percent of wages -- and deposits them into health savings accounts called Medisave. Medisave accounts are used mostly for inpatient expenses, but also some outpatient ones. Singaporeans are expected to pay most of their outpatient expenses with non-Medisave cash.

On top of Medisave, Singapore has a government-run catastrophic insurance program called Medishield. Singaporeans can opt out of that plan and buy private catastrophic insurance. Premiums for Medishield can be paid for using the Medisave health savings accounts.

Then there is Medifund, a safety-net program for the bottom 10 percent of income earners, and Eldershield, a private insurance program for long-term care for those with old age-related disabilities. On top of these government-sponsored programs, Singaporeans can buy supplemental insurance for things like outpatient expenses.

Why does this system work so well? Because it incorporates the central idea behind free-market health care: that health-care spending is most efficient when that spending is executed by individual patients, rather than third parties. It's easy to waste other people's money. But if that money is your own, you are going to try your best to spend it wisely.

Singapore installed this system relatively recently. Prior to 1984, the former British colony had a system quite similar to that of Britain's National Health Service. In that year, the government reversed course, with impressive results. Singapore, of course, isn't a democracy -- which allows the government to install sweeping changes that wouldn't be realistic here. (And in no way should my praise of Singapore's health-care system be interpreted as an endorsement of the country's political system.)

The Swiss and Singaporean models wouldn't be perfect fits for America; we would want to replace the Swiss individual mandate, for example, with a more market-oriented approach like allowing people to opt out of buying health insurance if they also agree to forego subsidized care. But they both embody the most important principle of all: shifting control of health dollars from governments to individuals.

How could something like this come about in the United States? One could imagine a scenario in which Medicare was converted into the premium-support model, such as one of the Paul Ryan plans, with far more aggressive means-testing such that upper-income seniors would no longer be eligible for the program. In addition, the tax exclusion for employer-sponsored health insurance is phased out. The resultant savings could be used to offer subsidized private insurance to lower-income individuals, as a replacement for Medicaid. Obamacare's exchanges, though seriously flawed in their implementation, have some similarities to this approach. As these programs converge, we could have something that starts to look a lot like Switzerland.

The Singaporean system dovetails with an idea put forth by John Goodman and others: of a universal tax credit that Americans could use to buy health insurance, or possibly even Medisave-like HSAs.

My message to conservatives is: wake up. America's health care system has many qualities, but it is far more socialized than you think, and we can learn from the experience of other countries to make it better. My message to liberals is: if universal coverage is your goal, the possibility for bipartisan compromise exists, if you're open to considering market-oriented approaches like those in Switzerland and Singapore. Let's put our heads together.

.
Enhanced by Zemanta

How to Safely Catch a Falling Knife

Difference Between Stocks and Bonds
Difference Between Stocks and Bonds (Photo credit: Philip Taylor PT)
By Wealthy Retirement

New York, Aug.13, investment opportunities .- Despite the five-year run-up in the market there is a way to get great bargains by playing the beaten-up industries – i.e. bottom-fishing. And there is a technique that can allow you to do it without the usual risks associated with trying to catch falling knives…
Today I'm going to share a great example of how to use the technique to earn a reliable double-digit yield, but first let me explain why most bottom-fishing strategies fall short…
Knowing when a bargain will stop becoming an even better bargain is almost impossible to predict. Wall Street's paved with the blood of those who thought they could – and learned the hard way they could not.
That's why the only investors who typically venture into bottom-fishing for cheap stocks are:
  • Novices who don't know any better, or…
  • The very experienced who periodically get a little too full of themselves and forget the costly lessons the market has taught them.
But there is a way to benefit from bottom-fishing without all the risks of the "falling knife syndrome." Using it successfully requires stretching the envelope a little, but the rewards can be huge.
And, this strategy eliminates almost all the high-risk aspects of bargain hunting. It can be a big income producer and generate great capital gains, as well.
Three Reasons Cheap Bonds Are Better
Despite what most people think, bonds – all bonds – fluctuate in value. In fact, if an industry is getting hit particularly hard, corporate bonds, on a percentage basis, can drop in value almost as much as some stocks.
But there are several differences that make cheap bonds a much safer and more predictable way to play the bottom…
The first is the fact that no matter how low a bond's price drops, or how much it drops after you buy it, it continues to pay its interest. The coupon, which is cast in stone when the bond is issued, is cranked out every six months no matter what happens to the market price of the bond.
For instance, a 7% coupon will pay $70 a year in two equal payments, until maturity, whether the price goes up or down. And, unlike dividend stocks, the interest is paid to the bondholder from the time he takes possession.
So, the first big hurdle in bargain hunting is avoided; with bonds you make money all the way to maturity, from day one, no matter what the price does.
The next big difference between stock and bond bottom-fishing is no matter what you pay for a bond, at maturity, you get $1,000 for it. And yes, this is cast in stone, too.
Imagine being able to buy a stock at a 15% or 25% discount and know that in a set amount of time you will be paid the preset price of $1,000 for it. It seems almost too good to be true, but that is exactly what bonds offer.
The third big advantage of cheap bonds is that you know, before you invest one penny, exactly when and how much you will earn in interest and capital gains. There is no guesswork!
The interest and principal are paid on preset dates and, short of a default, which in this market is less than a 2% risk, nothing will change that.
AK Steel: A Beaten-Down Bargain
Here's a bond in a very beaten-up industry, steel, that will pay a big capital gain at maturity, a huge interest rate for this market, and you will know before you invest one dime how much your total return will be and exactly when you will receive every penny.
AK Steel has a bond (CUSIP - 001546AL4) with a coupon of 7.625% that we can buy now for about 86.2, or $862 per bond. At maturity in May 2020 we will receive $1,000 per bond in principal, $138 in capital gains, and will have collected 15 interest payments for a total of $571 per bond. That's a total return of $709 per bond, plus your principal.
On an income basis, $571 in interest equals a current yield of 8.84% per year. Current yield is based on our discounted purchase price of $862. It is calculated by dividing the coupon, 7.625%, by our cost, $862; 7.625 \ 862 = 8.84%.
Here's how the total return breaks down…
We have 15 interest payments of $38.12 every May and November until maturity, capital gains of $138 per bond at maturity, for a holding period of just under seven years, at a cost of $862 per bond, for an average annual return of 11.91%:
(15 x 38.12 + 132 / 82 / 862 x 12 = 11.91%)
The steel industry has been hit hard by the slowdown in China. The EU hasn't helped and the United States' own slow recovery has added to the drag, but the future looks very bright for AKS.
It's expected to move from a loss in 2013 of $0.50 per share to a profit of $0.31. That is a huge move in just one year!
Maybe more impressive are its five-year growth numbers. The industry is expected to grow at about 3.91%... But in the same period, AKS is looking at a 53% growth factor.
But, one of the best parts about bottom-fishing for bonds is, even if AKS doesn't hit these high numbers, even if it misses by a little – or a lot – it doesn't matter.
Unlike stocks, bonds are not dependent on the whims or the changing winds on Wall Street, or even quarter-to-quarter swings based on earnings.
As long as AKS is able to pay its bills when this bond matures (which with a 53% five-year growth estimate seems like a slam dunk), we will be paid every dime of our interest and capital gains. Even if stock and bond prices continue to drop, we still get paid.
That's how you bottom-fish. With cheap bonds you can…
  • Make money from day one.
  • Exceed the long-term return of the stock market by almost four points.
  • Know when and how much you will earn before you invest.
Bonds can reshape your entire investing life. They offer predictability, reliability, above-average annual returns and none of the risks associated with falling knives.
Take a look at cheap bonds.
...
Enhanced by Zemanta

How to Play the Coming Bond-Market Rout

Bull Itch
Bull Itch (Photo credit: emilio labrador)
By Investment U

Washington, Aug.13, hot stocks .- You know it's coming. Every experienced investor who is paying attention knows it's coming. I'm talking about the upending of bonds that will take place in the months and years ahead. However, there is a smart, low-risk way to play it... and earn a decent return.

Let's start with the basics. Picture a seesaw with interest rates on one side and bond prices on the other. When interest rates go down, investment-grade corporates and Treasuries go up. When interest rates go up, these same bonds go down.

Why is this so? Think about it. If new bonds are coming out with higher coupons, your old bonds must fall in price so that the yield rises to what new ones are paying. If that weren't the case, your bonds would be unsalable. After all, no one voluntarily buys similar (or identical) bonds with lower yields.

Let me concede that ordinarily I am not a stock or bond market timer. But I take off my "market-neutral" cap under certain unusual and well-defined circumstances. In the stock market, it's when values and sentiment reach extremes.

For example, when low valuations combine with great fear and anxiety - as they did in the depths of the recent financial crisis - you can buy with confidence, content in the knowledge that this is virtually always a superb long-term opportunity. And when high valuations combine with optimism and euphoria - as they did in the housing bubble six years ago or the Internet bubble 13 years ago - you need to pare back or get the heck out, confident that history shows these situations always end badly.

There are two reasons that this is one of those rare times in the bond market.

The first is that we are at the tail end of the greatest bull market in bonds in more than 100 years. Too many fixed-income investors are either naive - looking solely at historical returns - or complacent. From the peak of interest rates in the hyper-inflationary early '80s, interest rates have now declined to the point where most investment-grade bonds offer a prospective negative real return. (In other words, your return after inflation is likely to be less than zero.)

The other reason is that the Federal Reserve, in its attempt to goose the economy, has distorted the fixed-income market. Recall our seesaw. When the Fed buys bonds to keep mortgage rates and other long-term rates artificially low, it does it by driving bond prices artificially high.

Do you really want to own a low-paying asset that the federal government is temporarily pricing high? I didn't think so. That's why you should minimize or eliminate your exposure to long-term bonds. Those are the ones that will be hurt the most when interest rates rise.

But don't abandon the bond market altogether. You should still own high-yield bonds and inflation-adjusted Treasuries. And with your high-grade bonds, tweak your portfolio by moving into shorter-term maturities.

Yes, even these bonds will decline in price when interest rates go up, but not by much. Let me give you an example.

Call or check online to find out the average maturity of your bond funds' holdings. This is called the duration. If a fund has a duration of three years, for instance, it will decline 3% if interest rates rise one full point. If the duration is two years, it will decline 2%.

But a full percentage point rise is pretty big. And, remember, this temporary decline in price will be offset by the interest payments (or bond fund dividends) you receive.

Investors who are shifting to money-market accounts that pay essentially nothing to avoid the looming bear market in bonds are making a mistake. If the rise in rates is slow and steady - a good bet since inflation is low with commodity prices soft and wages stagnant - or a long time in coming, you will make out better in short-term bonds.

So don't flee the high-grade, fixed-income market. Just adjust your fixed-income portfolio by shortening the duration.

After all, successful investing is about managing risk, not running from it.

...

Enhanced by Zemanta

Monday, August 5, 2013

The Bull Is Confirmed — This Market Looks Very Strong

NASDAQ building
NASDAQ building (Photo credit: niallkennedy)
Even a soft jobs number can't keep this rally down


The big headline number, the unemployment rate, fell to 7.4% from 7.6%. But the labor participation rate fell to 63.4% from June’s 63.5%, which shows that a number of workers have dropped from the labor force. This capitulation has caused much of the decline in the unemployment rate. Payroll growth fell and the average workweek dropped to 34.4 hours from 34.5. Wages fell 0.3%.
At the close the DJIA was up 30 points to 15,658, the S&P 500rose 3 to 1710, and Nasdaq gained 14 to close at 3690. The NYSE traded 681 million shares and Nasdaq crossed 361 million. Advancers edged decliners on the Big Board by 1.1-to-1, and on Nasdaq decliners were ahead by 1.1-to-1.
For the week, the DJIA rose 0.6%, the S&P 500 gained 1.1%, and Nasdaq was up 2.1%.
Chart KeyOur trusty long-term chart of the S&P 500 with its 17-month moving average shows no sign of weakness and is a strong confirmation that the long-term bull market is not only intact but has gained momentum. Note how the index jumped from a slight correction after topping the highs of 2000 and 2007 as buyers hopped on the profit-taking.
08042013 collins djt confirm
Click to Enlarge
The Dow Transports rallied to a new high, confirming the previous high made by the DJIA. This is further confirmation of a powerful bull market — a new Dow Theory buy signal.
Conclusion: Despite what appears to be sluggish buying, the broad market is acting well, with wide participation and a confirming new Dow buy signal. I’d like to see both volume and breadth pick up a bit, but the major indices are in uncharted territory — the only thing that appears to be holding back stocks from another jump is a steady stream of profit-taking and a reluctance by the small investor to make a big commitment in stocks. As long as the little guy is timid, the institutions will continue to walk the market higher.
The threat of a terrorist attack will probably add to small investors’ fear, causing them to remain cautious. Our strategy is to hold for more gains and buy into any weakness.
Many thanks to Serge Berger for his superb market analysis during my absence. I believe Serge is one of the best technicians in our business. Now, if someone could only help me unpack the hundreds of boxes in my garage!
..
Enhanced by Zemanta

S&P 500 follows through, gold falls

English: Target sponsored IndyCar visiting Pur...
English: Target sponsored IndyCar visiting Purdue University on Toyota Day. (Photo credit: Wikipedia)
By Colin Twiggs

Sydney, Aug.5, investment opportunities .- The S&P 500 followed through above resistance at 1700, indicating an advance to 1800*. Bearish divergence on 21-day Twiggs Money Flow suggests selling pressure, but this is not as pronounced on the weekly chart and a peak above the May high would negate this. Reversal below support at 1675 remains unlikely, but would warn of another test of primary support at 1560.


S&P 500
* Target calculation: 1680 + ( 1680 - 1560 ) = 1800
The VIX below 15 indicates historically low market risk.
VIX Index
The Dollar Index is testing resistance at 82.50. Breakout would indicate the correction is over, suggesting an advance to 84.50. A 63-day Twiggs Momentum trough above zero would strengthen the signal.
Dollar Index
Gold continues to test support at $1300/ounce. Breach would suggest another test of primary support at $1200, while failure of primary support would offer a target of $1050*. Dollar Index breakout above 82.50 would strengthen the bear signal. Recovery above 1350 is less likely, but would indicate continuation of the rally to $1400/ounce.
Spot Gold
* Target calculation: 1200 - ( 1350 - 1200 ) = 1050
The Euro broke medium-term resistance at $1.32 and is testing the next level at $1.34. Breakout would indicate a primary advance, while respect of resistance (indicated by reversal below $1.32) would warn of another test of primary support at $1.27. Close oscillation of 13-week Twiggs Momentum around the zero line reflects hesitancy.
Euro/USD
* Target calculation: 1.34 + ( 1.34 - 1.28 ) = 1.40
Sterling is testing primary support at €1.135 against the euro. Long tails indicate buying pressure and recovery above €1.165 would suggest that a bottom is forming. Breakout above €1.19 would complete a double bottom with a target of €1.24. Recovery of 13-week Twiggs Momentum above zero would strengthen the signal.
Pound Sterling/Euro
* Target calculation: 1.19 + ( 1.19 - 1.14 ) = 1.24
Against the greenback, Sterling is testing medium-term resistance at $1.54. Last week's long tail suggests buying pressure. Breakout would offer a target of $1.575. Respect is less likely, but would indicate another test of primary support at $1.485. Recovery of 13-week Twiggs Momentum above zero would strengthen the bull signal.
Pound Sterling/US Dollar ...
Enhanced by Zemanta

Life in a Modern Debtor Nation

Deng Xiaoping
Deng Xiaoping (Photo credit: Wikipedia)
By The Daily Reckoning


Chicago, Aug.5, hot stocks .- Amazing how much difference a few years makes. We first visited China in the 1980s. It was an appalling dump. Few cars. Few roads. Almost no decent restaurants or hotels.

Now in Beijing you see large black luxury automobiles everywhere... and modern highways crisscrossing in front of huge hotels and apartment buildings.

The Chinese have made real progress!

Nobody had any money in China in the 1980s. In contrast, today you lose control of your car in downtown Beijing and you are bound to run over at least a couple of millionaires.

"We are very much aware of our extraordinary good fortune," said a Chinese man in his 50s. "We grew up with nothing. Now we are able to dine in fine restaurants, live in fine houses and travel to other parts of the world.

"I thank Chairman Deng Xiaoping for having the wisdom to point us in the right direction... and the Party leadership for having the good judgment to keep us on the right road."

The Party leadership is not infallible. Neither in China nor in the U.S. In both countries, the feds -- looking out for themselves -- make policy decisions that are disastrous for others.

We were in China for only a few days. We have no idea what calamity the central planners will cause there. But we can take a fair guess of what they will do to America. Broadly, China's feds build too many factories, malls and apartments. America's feds encouraged the opposite error -- borrowing and spending too much for consumption purposes.

China's real wages doubled in the last 10 years... after doubling in the previous 10 years. That is why the Chinese feel so much better off. They ARE much better off.

"Yes, we know there may be a slowdown... or even a financial crisis... coming. But we have gone ahead so far so fast we can put up with a little backsliding," said our friend cheerfully.

Americans are not likely to be so cheerful about it.

Let's see... According to the official numbers, $1 when we were born (right after World War II) was worth about $10 today.

But the official numbers are fishy. An average house in 1950 sold for less than $10,000. Today (after a big sell-off following the subprime mortgage debacle of 2008) the typical house sells for about $150,000.

On that basis, keeping up with your No. 1 cost -- housing -- would require 15 times as much money as it did in 1950.

Do people earn 15 times more now? After the war, a typical family had a single wage earner with a salary of about $250 a month -- or $3,000 a year. The minimum wage was 75 cents an hour -- or about $120 a month. On an average wage, a man was able to support a family and buy a new car every three or four years. A new Oldsmobile Rocket 88 cost about $1,500 -- or about half of a year's wages.

Today, a median wage earner gets $30,000 a year --10 times as much in nominal terms. But now, despite the feds' phony numbers, he has much less buying power.

Without even starting to calculate the effects of higher taxes, health care and education expenses, we can see he has to devote at least a whole year's wages to buying a new family car -- twice as much as in 1950.

As for the house, that's five years of wages -- also twice as much as it was in the 1950s.

As you can see, the real wages of the typical working man in the US have gone down for the last 60 years. In terms of his time, his most important purchases are more expensive today than they were in 1950.

How did American workers survive with lower real wages and higher living costs?

First, they began to work longer hours. Wives went to work. Husbands worked a second job. Now Americans work more hours than any other group.

Second, and most importantly from our point of view, they began to borrow. Aided, induced and bamboozled by the feds' EZ credit policies... they went deep into debt to keep up with their own standards of living.

Almost everyone misunderstands why. They think deregulation allowed capitalists to take more money away from the proletariat. Or that "the rich" suddenly became greedier.

We presume the rich are always equally greedy -- just like the poor. And we note that the total volume of regulation actually increased during the period under review. Just look at the tax code... or SEC rules. There are far more rules now than there were in 1950.
Actually, something else was happening... something subtler and more insidious. Here's Bloomberg with more evidence:
The US homeownership rate, which soared to a record high 69.2% in 2004, is back where it was two decades ago, before the housing bubble inflated, busted and ripped more than 7 million Americans from their homes.
And more claptrap solutions:
With ownership at 65% and home values rising, housing industry and consumer groups are pressing lawmakers to make the American Dream more inclusive by ensuring new mortgage standards designed to prevent another crash are flexible enough that more families can benefit from the recovery. Regulators are close to proposing a softened version of a rule requiring banks to keep a stake in risky mortgages they securitize, according to five people familiar with the discussions.
How does that work? Easier credit? But not riskier credits? More laws? Good luck with that!

The American Dream did not break down because the lawmakers and the credit industry were not clever enough. It broke down because they were too clever by half.

President Obama is stumping the country now, promising to save the middle class. But he and the feds are the real reason the middle class is suffering. They created a monetary system that robbed society of real capital... and robbed workers of trillions of dollars of income.

Economists measure quantity. Alas, life is not all quantifiable. What really matters is quality. Right now, the Fed tries to control prices. But prices are only a part of the picture.

When it comes to art, architecture, music, puppies and women it's what strikes the senses that matters -- what you see, hear and feel.

But when it comes to your money, what you see is not exactly what you get. Price tells you something. But it doesn't tell you all you need to know.

Why? We're so glad you asked...

When bullion money was invented government quickly saw the potential. Control the money and you can control people. You control their assets. Their cost of living. Their time.

In ancient times controlling money meant you could buy people outright. You could buy war captives. Those who couldn't pay their debts often sold their children into slavery too. Or they themselves were forced into debt servitude.

In the world's oldest legal code -- the Babylonian Hammurabi's Code, set down some 4,000 years ago -- it says that children of debtors can be kept in slavery for three years. In the fourth year they must be released.

Clever readers will be on the edges of their chairs... ready to leap with indignation. America's youngsters, heirs to its $16.7 trillion national debt, will be kept in debt servitude far longer. Maybe even all their lives!

Bullion money was a new development. It made cheating harder to do. You didn't have to take credit. You didn't have to wonder if the family was honorable or solvent. You didn't have to wait to see if you'd get something in return. Instead, you could take a little piece of gold or silver and be done with it.

But the people who controlled the money could still diddle it. And the history of central banking is a history of diddling.

Paper money was a later innovation. It worked well -- as long as the paper was backed by gold at a fixed rate. But it offered more opportunities for cheating.

As we will see, governments are still at it -- led by the United States of America.

.
Enhanced by Zemanta