"No man can become rich without himself enriching others"
Andrew Carnegie


Tuesday, August 27, 2013

How to Spark a Fear Rally

Bull and bear in front of the Frankfurt Stock ...
Bull and bear in front of the Frankfurt Stock Exchange (Photo credit: Wikipedia)
By Rude Awakening

Baltimore, Aug.27, stock investing .- The sky is falling. Investors are panicking. But the market? The S&P is down about 2.5% from its August 2nd peak. What you're witnessing right now is the perfect recipe for a fear rally. I briefly mentioned Friday morning that investors pulled a net $9.4 billion out of U.S. stock funds last week. It's obvious the herd is terrified. Even the sentiment polls have sharply reversed from bullish to downright bearish…


"Turning to what caught my eye this week, sentiment polls showed some amazing spikes in fear on a less-than-5% pullback. As contrarians, this is exactly what you want to see," opines Ryan Detrick, Schaeffer's senior technical analyst. "It doesn't mean the market has to bottom here and now, but it increases the odds of a lasting rally once we get moving again."

Case in point: the American Association of Individual Investors poll. Detrick notes the bears (the poll now has them at 52%) have advanced for six consecutive weeks. That hasn't happened since the AAII poll first started 26 years ago...

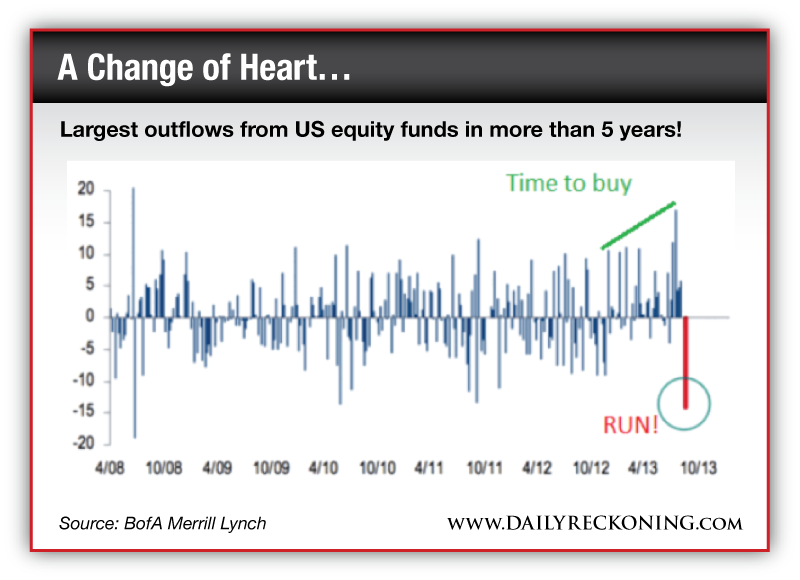
Adding to the slipping sentiment numbers is hard evidence proving many investors want nothing more to do with this market. Turning back to fund outflows, you can clearly see investors have abruptly turned on this year's bull market.


That's no mistake. We really did just witness the largest outflows from equity funds in more than five years. This fact is even more incredible when you realize that just two summers ago, eurozone fears helped crater the markets nearly 20%-- yet this month's small dip has triggered far more selling…

Fund outflows and newly bearish sentiment are setting us up for a bounce. While I still don't like the weakness we're seeing in the Dow, popular momentum stocks have held up well during this market pause. If these names continue to move toward new breakouts, you can expect the overall market's performance to improve as well over the next couple of weeks.

Fight any urge to "trade scared" this week. Set your brain to buy-the-dip mode while most investors are running from the market…

.
Enhanced by Zemanta

Get Ready for the Annual Retail Rebound

English: simulated Wal-Mart logo
English: simulated Wal-Mart logo (Photo credit: Wikipedia)
By Wealthy Retirement

New York, Aug.27, stock advice .- You may have come across this headline from a mainstream media outlet last Wednesday:

"Staples Plunges in One of Its Worst Sessions Ever"

The article pointed out how Wednesday's single-day plunge of 15% was one of the worst single-day losses Staples (Nasdaq: SPLS) has ever suffered... Second only to... drumroll, please... Aug. 15, 2012, when it fell 14.6%.

What struck me as odd (and bordering on lazy) was that the writer of this article - as well as the doomsaying commenters on the same article - failed to connect the dots. Think about it. The same company suffered near-15% one-day drops a year apart, almost to the day.

Instead, the writer wasted readers' time lamenting that retailers are reporting lackluster second quarter results as the consumer remains cautious. Yawn...

What I'm about to show you is that these two significant one-day drops (which both just so happened to occur on the day of the company's second quarter earnings release) are no coincidence. And once you understand what's happening, you can greatly improve your investing results - while substantially cutting your risk.

Here's what I mean...

Do You See a Pattern?

I'm just tossing this out there: Maybe Staples' second quarter results are consistently terrible. Maybe, you shouldn't buy Staples shares before its second quarter earnings release...

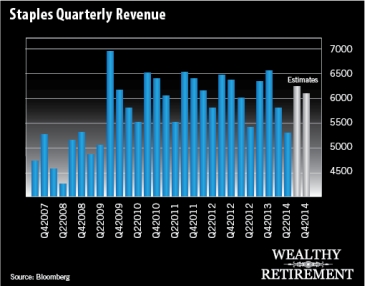
Let's take a look at Staples' quarterly revenue results:


What should be jumping out at you is that the second quarter for Staples is consistently its worst quarter... The only year it wasn't was in 2009, when the first quarter was the bottom.

We also see that the third and fourth quarters are consistently its strongest of the year.

That means the guy who wrote "Staples Plunges in One of Its Worst Sessions Ever" had the opportunity to tell investors that this is a frequent occurrence for the quarter... But he didn't.

Who's Buying in Summer? No One...

Now, let's look at the entire retail sector as a whole. There are plenty of headlines speculating on doom-and-gloom for the industry as second quarter results were largely lackluster.

In the following chart you'll see my Prime System Retail Index, which I use in Emerging Trends Trader. This index is made up of 21 companies. These include teen apparel retailers, big-box discount stores - such as Target (NYSE: TGT), Wal-Mart (NYSE: WMT) and Costco (Nasdaq: COST) - as well as mall-based chains and retail advertisers.

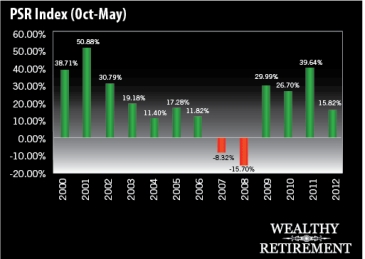
Here is how the Prime System Retail Index has performed from May to October since 2000 to today:


That's a lot of red isn't it?

In 14 years, there have been only five years of gains from May to October - during which the retail industry reports second quarter results. And 2003 and 2009 - the best years during this mid-year stretch - were both rebound years after market collapses.

So, you have to ask yourself: Is this year any different? Are shares of retailers acting outside of this normal seasonal pattern?

Currently, the Prime System Retail Index is down 3.99% since the start of May. The average return for this index from May to October over the last 14 years is -3.73%.

On average, eight companies in the Prime System Index will see a positive gain during the stretch from May to October...

And right now, there are exactly eight companies in the green.

Both figures are in line with the long-term average of the Prime System Retail Index.

That means what's unfolding right now is nothing that's out of character for the sector... In fact, this is exactly what we want.

Hello Holidays!

Obviously, the stock market is about buying low and selling high.

There's a pretty good chance if you're buying retail stocks in late spring, or before the second quarter earnings season, you're buying at a high point and are going to have to suffer through the seasonal low points we see for shares.

Now let's take a look at that same index and how the companies perform from October to May - the Prime Period for retail stocks (going from their low point to a high point)...


It's a totally different picture, isn't it?

Lots of green... And lots of solid returns year after year.

There were only two years of losses... The rest were all double-digit gains, with six years of gains of 20% or more.

The average return of the Prime System Retail Index from October to May since 2000 has been 20.63%.

On top of that, the average number of companies that have a positive gain during this Prime Period for retailers is 15 - almost double the number of those that see positive gains on average from May to October.

That's a pretty significant trend.

So, now you have to ask yourself: Is this year any different?

Are you going to let the mainstream media fear over retailers make you afraid? Or are you going to start creating a shopping list right now for retail stocks while there is blood in the streets and you know that the best time for the shares are ahead?

.
Enhanced by Zemanta

YouTube Boob Tube for the Taper Solution

Kicking Television
Kicking Television (Photo credit: dhammza)
By Daily Reckoning

Washington, Aug.27, online stock trading .- There are big bucks on the boob tube. When I was a kid, one of my mother's most common chastisements was to turn off the TV and go do something else. In her mind, anything was better than sitting relentlessly in front of the boob tube watching inane programs.

Well, it seems Ma was wrong. Not only did my retinas not burn out from staring at the TV, but I've managed to make over 128% so far this year by simply keeping an eye on it. I'd like to highlight some television companies that may be worthy of your investment dollars--especially if you're looking for a play that won't be affected by the Fed's taper talk.

Because despite what you may have heard, television is far from dead. On any given day, some 2.2 trillion hours of television are being watched across the United States, according to Nielsen.
More surprisingly, people watch television over 4.6 times longer than they surf the Web, according to recent data from New Media TrendWatch.

So it boggles my mind that so many stock-picking gurus have been touting Web companies with questionable revenue streams. Consider Facebook, which has barely made it back to its IPO price. In fact, more than 54% of the Web company stocks tracked by the Dow Jones Internet index have lost money or trailed the S&P 500.

Meanwhile, we've been quietly racking up gains with what's really making money in the modern media age.

Simply put, it pays to advertise. Almost all media live and die by advertising revenue. And advertisers have a very good reason to continue throwing their money at television stations -- nothing else can match their scope.

Television has the reach of nearly 89% of the total U.S. population. Radio offers only a scant 58.8% reach. Newspapers fall to a mere 36.1% of the nation. (No wonder The New York Times and Washington Post both dumped newspaper assets.)

The only thing that comes close to matching television's reach is the Internet -- currently hitting 73.1% of the population. Good, but nowhere near the total reach of television.

And advertisers know that not only do they reach more folks through television, but also they get more action. Advertising industry studies show that nearly 40% of consumers first learn of brands that they buy from TV ads, compared with only 8.7% from Internet ads.

Furthermore, 37.2% of people cite television ads when making purchasing decisions, against a paltry 5.6% who cite Internet ads.

This all points to the obvious -- that television controls the vast majority of ad spending. It now makes up 54% of all U.S. ad spending… up from 52% just a few years ago.

But there's even more good news on the television ad market. Local television websites continue to draw in new viewers, and ad dollars have followed. Local online advertising revenues nationwide are up over 175.19% over the past five years -- 1.3 times higher than the overall growth of Internet advertising spending.

Of course, audiences aren't the only thing about television that's growing. Televisions themselves have gotten huge. Decades ago, a 25-inch screen was a big deal. Today, you'll find screens reaching 40, 50, 60 and 80 inches… and even bigger. (Most of them built with technology from another favorite company of mine, Samsung Electronics. But that's a story for another issue.)

But the same concept of bigger is better is what's happening for television station companies as well. They're expanding into markets around their home regions and nationwide.

There are some key reasons for this. First, as noted above, television dominates media attention and spending. So the more stations you own, the better.

Second, expanding regionally helps lower costs. If you have news reporters in each locality, you can have fewer covering larger-scale events.

Also, when it comes time to buy content for your television stations, the more eyeballs you can reach, the better the deals you can cut with distributors.

Increasingly, the bigger television companies with more market controls are even getting national networks to pay them to put their content out on local broadcasts. And the same goes for cable and satellite providers. They know all too well that folks demand local news and content, as well as network broadcasts that all have to flow through or from local television companies.

Third, there's been a major shift in the way television is broadcast -- and it's continuing to evolve, setting up another major growth area for television broadcast companies.

Back in 2009, the U.S. government mandated a switch from analog television broadcasting to digital.

But with the newer digital broadcasting standards, broadcast television companies discovered they were using less spectrum than they were allotted. So now companies are using that excess spectrum to roll out additional channels that are even more tailored to specific viewer groups.

This sets up whole new revenue streams that advertisers and content providers are eager to work with, resulting in more cash for broadcasters.

And it gets even better. Wireless data for smartphones and tablets demand more and more bandwidth -- and companies like Dish Network and even the U.S. government want to buy, or at least contract to use, some of the excess spectrum broadcasters are sitting on.

This means that broadcast companies are sitting on an increasingly valuable additional asset.


1.3 times higher advertising spending than overall growth in Internet spending? Groovy.

Armed with all of this good news, leaders in local television are scrambling to buy more local stations and other broadcast companies.

Deals are now coming at a fast pace. Tribune has upped its television companies by 100%, to 42 nationwide. Its latest deal bought out 19 stations from privately held Local TV Holdings. And Gannett is in the process of expanding its station count to 43, with the additional 20 coming from its deal to absorb Belo.

For Lifetime Income Report readers, I've picked out three specific broadcasting companies -- with market caps of a billion dollars or less -- that make for very tempting new targets for speculative investors.

...
Enhanced by Zemanta

Thursday, August 22, 2013

The Bear Market Isn’t Here Yet, But…

New York Stock Exchange
New York Stock Exchange (Photo credit: Mike_fleming)
Resistance will prove tough to overcome and risk is incredibly high


Bonds fell in reaction to the notes, as did stocks, mainly because the injection of cash into the financial system appears to have had only a small impact on jobs growth.
The report said, “Nonetheless, the unemployment rate remained elevated, and the continuing low readings on the participation rate and the employment-to-population ratio, together with a high incidence of workers being employed part time for economic reasons, were generally seen as indicating that overall labor market conditions remained weak.”
At Wednesday’s close, the Dow Jones Industrial Average was off 105 points at 14,898, the S&P 500 fell 10 points to 1,643, and the Nasdaq lost 14 points at 3,600. The NYSE traded 657 million shares and the Nasdaq crossed 359 million. Decliners outpaced advancers on the NYSE by 2.8- to-1 and on the Nasdaq by 2.1-to-1.
Chart Key
The New York Stock Exchange Composite Index contains generally higher-quality stocks. But like the other higher-quality indices, the Dow 30 and the S&P 500, it too has failed to find support at the crucial 50-day moving average mark. Its next support is at the intermediate support line at around 9,200. MACD is on a sell signal.
The Dow Jones Industrial Average broke its 50-day moving average, as well as its intermediate support line five sessions ago. Wednesday’s late sell-off puts the index in line for a serious attack on the support line at 14,845, its breakout point in August. A failure to hold that line would put the 200-day moving average in its sight — and threaten the long-term bull market.
Conclusion: Technically, the better-quality stocks are facing a battery of resistance that should stymie short-term rallies. When each support line is broken, that line then becomes a resistance line — a place which has proven to be where sellers lurk. In addition, the overall configuration of the Dow is taking on the form of a broad topping process that would be complete with a close under 14,845.
In his recent Street Smart Report, Sy Harding referred to another excellent technician, Mark Hulbert, who sees three signs of a market top:
First, the S&P 500 is up 23% in the last 12 months. Most bull markets top at over 21%.
Next, one of the most striking patterns about the month leading to a top is that the “riskiest stocks far outperform conservative ones.” We’ve discussed that at length in this column.
Finally, he mentions Warren Buffett’s favorite measure of market valuation — market capitalization versus GDP. In July, it reached 118%. The last times it went over 100% were in 1999 and 2007.
I, like Sy, don’t believe that we are beginning a bear market, although as he puts it, “But the risk is as high as in 2000 and 2007.” Ouch!
Enhanced by Zemanta

Global selling pressure

By Colin Twiggs

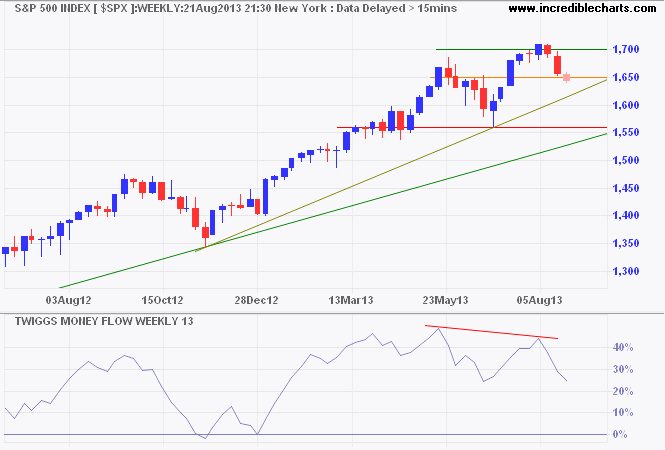
Sydney, Aug.22, investment opportunities .- The S&P 500 Index broke medium-term support at 1650 and is headed for a test of the rising trendline. Respect would indicate the primary up-trend is intact, but bearish divergence on 13-week Twiggs Money Flow warns of selling pressure. This is also evidenced by the marginal new high in August. A test of primary support at 1560 is likely. Breach would offer a target of 1400*.


S&P 500 Index
* Target calculation: 1550 - ( 1700 - 1550 ) = 1400
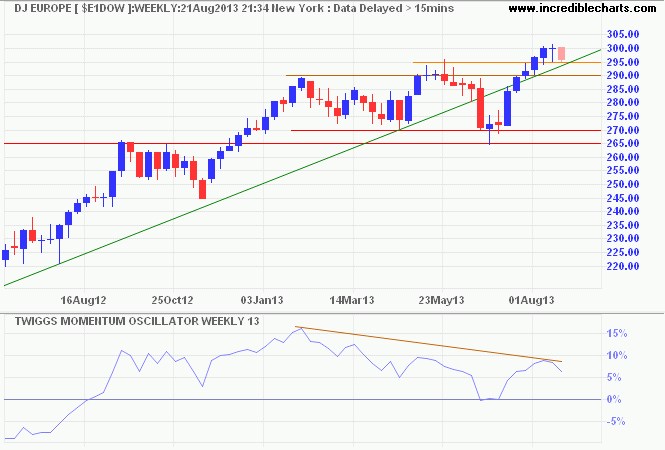
Dow Jones Europe Index also displays marginal new highs in May and August. Penetration of the rising trendline indicates the up-trend is losing momentum — also indicated by bearish divergence on 13-week Twiggs Momentum. Reversal below support at 290 would strengthen the warning, but only failure of support at 270 would signal a trend reversal.
Dow Jones Europe Index
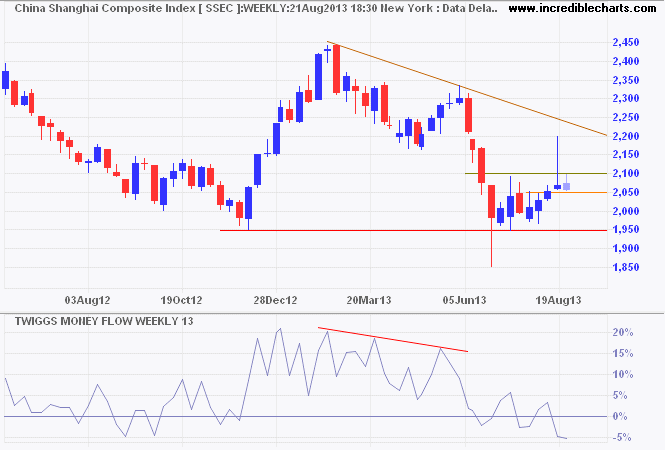
China's Shanghai Composite Index ran into strong resistance at 2100. Declining 13-week Twiggs Money Flow (below zero) warns of selling pressure. Reversal below 2050 would indicate another test of primary support at 1950, suggesting a decline to 1800*. Breakout above 2200 and the descending trendline is unlikely, but would signal that a bottom has formed.
Shanghai Composite Index
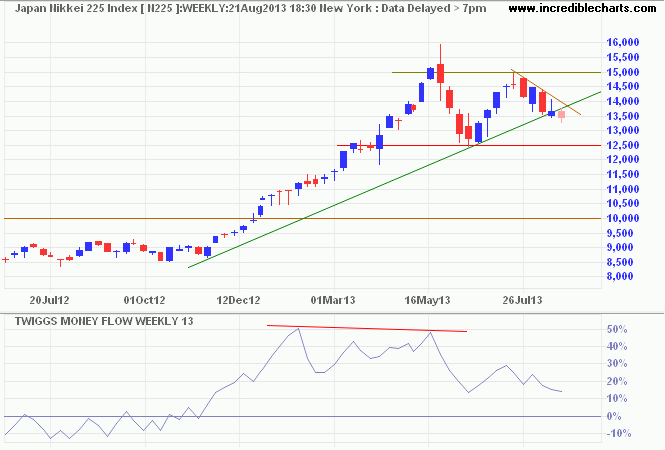
Japan's Nikkei 225 broke medium-term support at 13500. Follow-through below 13250 would indicate a correction to primary support at 12500. Penetration of the rising trendline suggests that the primary up-trend is losing momentum. Earlier bearish divergence on 13-week Twiggs Money Flow also warns of a reversal. Recovery above the declining trendline is less likely, but would indicate the correction has ended.
Nikkei 225 index
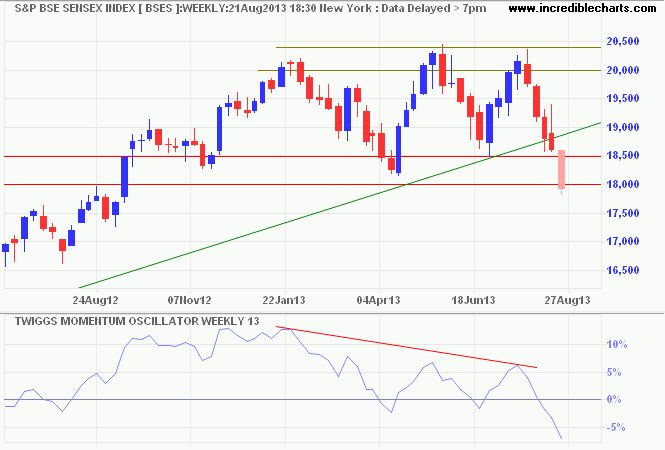
India's Sensex broke primary support at 18500, following through below 18000 to remove any doubt. The primary trend has reversed after a triple top and now offers a target of 16500*. Declining 13-week Twiggs Money Flow confirms selling pressure. Recovery above 18500 is unlikely, but would warn of a bear trap.
Sensex
* Target calculation: 18500 - ( 20500 - 18500 ) = 16500
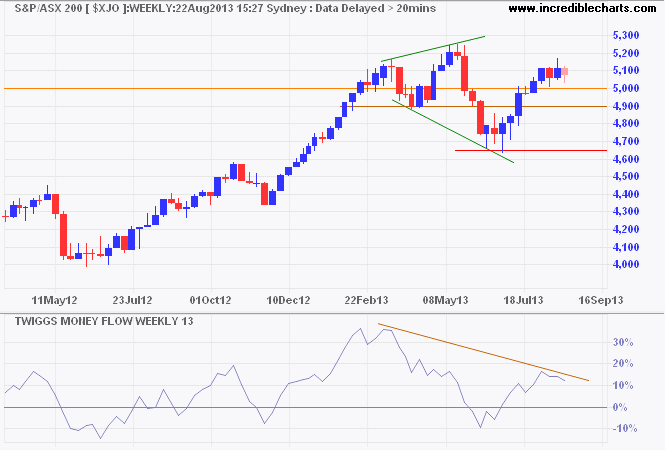
The ASX 200 is consolidating in a broadening top around the 2010/2011 high of 5000. Correction to 4900 would be quite acceptable, garnering support for an advance to the upper border, but breach of 4900 would indicate a failed swing, warning of reversal to a primary down-trend. Failure of primary support at 4650 would confirm. Bearish divergence on 13-week Twiggs Money Flow indicates selling pressure; strengthened if the indicator reverses below zero. Respect of support at 5000 is less likely, despite the long tail on today's candle, but would offer a target of 5300*.
ASX 200
* Target calculation: 5150 + ( 5150 - 5000 ) = 5300 ...
Enhanced by Zemanta

3 Reasons to Ditch Your Bear Suit

Bull and bear in front of the Frankfurt Stock ...
Bull and bear in front of the Frankfurt Stock Exchange (Photo credit: Wikipedia)
By Rude Awakening

Baltimore, Aug.21, free portfolios .- Don't give up on stocks just yet. In this market, the early bear gets squeezed.

It's just plain dangerous to bet against a low-volume drop like we're seeing right now. Heck, we're not even officially experiencing a correction. Or a meaningful dip. But that hasn't stopped the crash brigade from declaring once again that this is the beginning of the end for stocks…

"Suddenly, everyone is talking about this being a correction. I would say that at the current moment, we are just barely in a dip but possibly headed toward a correction," says Josh Brown of The Reformed Broker. "With a market pause that is not yet even a 5% dip - let alone a 10%+ correction - people (myself included) have been jumping the gun in trotting out the C-word so early."

He's not alone.

These low-volume drops have investors running in circles. There are no bulls in sight. Everyone is expecting the worst…

I'm not saying you should completely ignore this month's market action. But there's no reason to sell everything and set yourself on fire out on the front lawn…

Here are three reasons you shouldn't jump headfirst into the bear market camp just yet:

1. It's August

Trading volume is almost non-existent right now. And for the past several years, we've seen quite a few wild price swings in August that didn't stick. It's entirely possible that buyers kick it back into gear after Labor Day…

2. The Taper is coming?

Every dip in this market since the November 2012 bottom has coincided with a big policy fear. First it was the Fiscal Cliff. Then it was Sequestration. Now it's the Taper. The safe bet so far is that none of it really matters as much as people think it does.

3. Hysteria

Investors should welcome a dip. Dips are opportunity. But that's not the vibe I'm getting as the market creeps lower this month.

Bespoke Investment Group reports that bullish sentiment among newsletter writers has declined to its lowest levels since late June. This piece of data is usually a great contrarian indicator.

Also, don't ignore pockets of strength in this market. While the Dow coughed up its gains yesterday and closed in the red, the Russell 2000 finished the trading day up more than 1.5%.

It's never a good idea to trade on your fears. Keep a level head and let price guide your decisions. The dog days of summer are almost behind us…

.
Enhanced by Zemanta

The Timeless Wisdom of Izzy Stone

Stones
Stones (Photo credit: rkramer62)
By Daily Reckoning
Chicago, Aug.22, free stock tips .- "I sought in political reporting what Galsworthy in another context had called 'the significant trifle' -- the bit of dialogue, the overlooked fact, the buried observation which illuminated the realities of the situation." -- I.F. Stone, The Haunted Fifties (1963)

I start with a hidden problem in the stock market's latest earnings report card. Overall, earnings rose about 2% for the quarter. But if you take out the financials (banks, insurers), earnings actually fell by 3%.

That's a problem.

I appeared on Fox TV Friday morning. Before the show, I said I wanted to talk about this earnings stuff. The producer asked, "Do you think that's too technical to explain?"

"I should hope not" I thought to myself. I hope people understand that earnings (or profits) drive the stock market over the long term.

Specifically, the market rises and falls based on what the consensus guess is about where earnings are going. The market looks ahead. So you can match up the S&P 500 -- a broad proxy for the market -- with the consensus guess for earnings in the coming 12 months (the so-called "forward estimate").

Take a look at this chart from FactSet, which shows just that.


So if earnings fall -- or if people start to think earnings will fall -- the stock market also tends to fall. This is simple stuff. Trying to predict what will happen is, of course, anything but simple. I'd say it's foolish to even try. But people love this kind of thing -- especially TV people.

I was on Fox last week, on Aug. 7. I expressed the usual caution about the market, which I've been doing in these pages all year. Asked if it was time to sell, I said "Absolutely." I told viewers that my C&C portfolio was down to just nine names. We have historically carried 20-25.

Anecdotally, I said, that tells you what I think of the market. It was a lucky call, because the market has done nothing but drift lower since. (It got me a return invite. They want to know what I think now.)

People are starting to worry about earnings. They are also worried about when the Fed will stop pouring free drinks and end the party -- which, in a roundabout way, still comes down to a worry over earnings.

The earnings for the second quarter seem to foreshadow a decline ahead.

I've already pointed out the fact that if you exclude the banks, earnings actually fell. In some sectors, the decline was ferocious. The mining sector's profits were off 59%. (Fortunately, we put ourselves in a great position here. We long ago dumped all of our miners and commodity plays. Instead, we bought the financials. Today, we enjoy the profits -- and savings -- of that decision.) The overall growth in earnings was the third-slowest growth rate in the past four years (or 16 quarters).

Also, the number of positive surprises was the lowest since 2008. And of the number of companies that gave guidance for the third quarter, about 80% have issued negative guidance. Meaning they've taken their forecasts down a notch or two. As a result, the expected earnings growth rate for the third quarter is 4.3%, down from 6.7% at the start of the quarter. That figure is still probably optimistic.

In summary, for anyone who takes a deeper look into the market's working engine (those earnings), there are plenty of worn-out parts that look like trouble down the road.

Taking a deeper look is what Izzy Stone was all about.

I.F. Stone (1907-89), or "Izzy" as he was known, wrote and self-published a newsletter called I.F. Stone's Weekly for nearly two decades. It was influential in its time. At its height in the 1960s, Stone had about 70,000 subscribers.

His focus was political reporting. He was famous for digging through the public record and finding things that people missed. As he described it so eloquently, "I sought in political reporting what Galsworthy in another context had called 'the significant trifle'-- the bit of dialogue, the overlooked fact, the buried observation which illuminated the realities of the situation."

His work has earned him a place among the best investigative reporters that ever lived. I find him inspirational in my own efforts in trying to put together a newsletter attuned to those same "significant trifles." Stone would've made a heck of a financial newsletter writer.

Among my favorite nuggets of wise advice from Stone:

"If you're going to be a newspaperman, you are either going to be honest or consistent. If you are really doing your job as an observer... it's more important to say what you see than worry about inconsistency. If you are worried about that, you stop looking. And if you stop looking, you are not really a reporter anymore. I have no inhibitions about changing my mind."

I don't think I have to point out how this applies to markets. Certainly, if you come at the market with a strong view, you are apt to overlook the possibly important trifle that doesn't fit your worldview. And that trifle might be the clue that gets you ahead of the crowd.

More from Stone:

"The search for meaning is very satisfying, it's very pleasant, but it can be very far from the truth. You have to have the courage to call attention to what doesn't fit. Even though readers are going to say, 'Well, two weeks ago you said this.' So you did. And maybe you were wrong then, or partly wrong, but anyway, you've just seen something that doesn't fit, and it's your job to report it. Otherwise, you're just the prisoner of your own preconceptions." [Bold added.]

This is not just for newsletter writers. This is for thinking people everywhere.

We should realize that we are all, to some extent, prisoners of our preconceptions. And we should all work to not let those preconceptions blind us to opportunities (or pitfalls) staring us in the face. Aim to take opportunity (and see trouble) where it lies, and don't try to force the market to live up to your preconceptions.

Izzy's world had its center in Washington. Our focus is Wall Street. Both places have many affinities. Power and money are their chief currencies. Deception and sleight of hand are common skills. It's easy to get discouraged when you get close. Izzy never did.

"I felt that if one were able enough and had sufficient vision," he once wrote, "one could distill meaning, truth and even beauty from the swiftly flowing debris of the week's news." Stone's essays did that with wit and good writing.

If you are interested, I recommend The Best of I.F. Stone as a starter. If you want more, you can move on to Stone's six-volume A Nonconformist History of Our Times, which starts in 1939 and runs until 1970. I've also read two excellent biographies: All Governments Lie! by Myra MacPherson, and American Radical, by D.D. Guttenplan.

I live in a suburb of Washington, D.C. (If you step outside and listen closely, you can hear the beating heart of the Empire.) Last night, I headed down to the Penn Quarter to meet a couple of friends for dinner. Izzy used to write his Weekly from Washington and lived only a couple of miles from where I was.

It's unseasonably cool in Washington. We ate out on the patio at chef Jose Andres' Jaleo restaurant. (Best tapas restaurant in town.) My friends were globe-trotting investors, and I was hoping to get a useful lead or two. And I did. Never stop looking, Izzy used to say. More another time...
...
Enhanced by Zemanta

Great Company, Unstable Dividend

An assortment of United States coins, includin...
An assortment of United States coins, including quarters, dimes, nickels and pennies. (Photo credit: Wikipedia)
By Wealthy Retirement

New York, Aug.22, free stocks .- Blackstone Group L.P. (NYSE: BX) is one of the world's largest and most successful investors. It runs a diverse group of funds that invest in a wide variety of assets including stocks, real estate, private equity, etc. Blackstone has nearly a quarter of a trillion dollars under management.

The company makes a lot of money. In the first six months of the year, its profit was $938 million. That's up significantly from $512 million the year before.

And Blackstone pays a decent dividend. In the first six months of the year, it has paid $0.53 per share. Annualized, that comes out to a healthy 4.9% yield.

However, the dividend fluctuates strongly from quarter to quarter and year to year.

In the first quarter, the distribution was $0.30. The second quarter distribution fell to $0.23. So for an investor who needs a reliable income stream, Blackstone doesn't deliver.

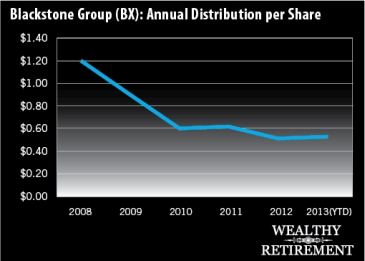
You can see from the chart below, the company's dividend history has been all over the place. It lowered the dividend in 2009 and 2010. Raised it slightly in 2011, cut it in 2012 and now will grow the dividend in 2013.


In the first six months of the year, the company's distributable earnings (a measure of cash flow) was $729 million. During that time, it paid out $905 million in distributions. Last year at this time it also had paid out more in distributions than it earned.

The company has a policy in place that the dividend will be at least $0.12 per share, even if it has to "borrow" money from future quarters to pay for it. Fortunately for shareholders, the company hasn't needed to do that yet, but it is possible it will in the future if business takes a bad turn.

When I discuss the safety of a dividend in these Safety Net columns, my main goal is to try to figure out if the dividend will be cut in the not-too-distant future. Although I always prefer dividend growth, a stable dividend will still merit a high rating.

Unfortunately for Blackstone shareholders, the dividend is anything but stable.

That doesn't mean it will get cut to zero. Blackstone is a very well-run company that makes lots of money. But it has no track record whatsoever to speak of when it comes to a stable dividend. Some years it goes up. Others it comes down by a significant amount.

Blackstone may be a suitable investment for those who are looking for growth (I haven't analyzed the stock for its growth prospects) and who will be happy with whatever income they happen to get.

Other investors who see that 4.9% yield and are willing to take their chances that the dividend doesn't get reduced too much in the future could wind up happy too. I'm not saying they will, just that it's a possibility.

But since this column is all about safety, I have to warn investors who need a reliable quarterly dividend check that Blackstone is NOT for you. Its dividend is just way too unpredictable. You never know what you're going to get in any given year.

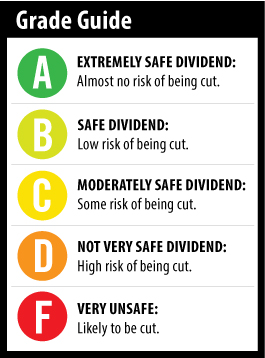
Dividend Safety Rating: F

If you'd like me to review the dividend safety of one of your stocks, leave the ticker symbol in the comments section below. But before you do, check to see if I've written about it already. Enter the ticker symbol or name of the company in the search box in the upper right corner of the website.

Enhanced by Zemanta

52 Members Of Congress Own This High-Yield Stock -- Should You?

United States Capitol Building
United States Capitol Building (Photo credit: Jack's LOST FILM)
By Street Authority

Washington, Aug.22, hot stock picks .- It's the most popular high-yield stock owned by Congress. And they might be on to something. Right now this stock yields 5.3%… and it's one of the most stable dividend-payers in America. During the recession, dividends stayed steady. And in the past five years investors have enjoyed five annual dividend increases.
At last count, 52 members of Congress -- 19 Democrats and 33 Republicans -- owned shares of this company.
I'll tell you more about the stock in a moment. But first, I think you should understand why it's important to know that Congress owns the stock at all...
A few years back, "60 Minutes" finally blew the lid off the entire thing.
To make a long story short, insider trading was legal for members of Congress and many of their high-ranking aides for years. They could trade based on the information they encountered in their day-to-day work, even it if it was non-public information.
We had been telling readers about this for months before Congress finally changed the rules. In fact, we even put out a special report -- Congress' Dirty Secret -- that outlined the problem and also showed people how to find out what their Congressman owned with a few clicks of a mouse.
But there's no illusion here. We could scream about the problem until we're blue in the face. However, when "60 Minutes" -- one of the most-respected investigative journalism programs on television -- dedicates a segment to the issue, the nation pays attention.
And we were happy to see all that attention lead to a change with the passage of the STOCK Act. There's no doubt that this was a problem. According to data from the Center for Responsive Politics, 247 of the 535 members of Congress are millionaires. That's 48%! In other words, being a millionaire makes you "average" in Congress.
Meanwhile, according to a Barron's story, members of Congress outperform your typical investor by an extra 6.8 percentage points each year.
Knowing all that, you would think looking at the most popular stocks in Congress would shed light on some super secret investing strategy that would produce better returns than everyone else. After all, they could make trades based on insider information.
But according to Factset, a research firm specializing in money in politics, the most popular dividend stock owned by Congress is one of the best known companies in the world. And though the rules have changed to disallow Congress from making investments from insider information, the most recent data available is from 2011, before the STOCK Act passed.
And let me be clear. We're not suggesting that Congress had inside information on AT&T (NYSE: T) -- the high-yielding stock that's owned by more than 50 members of Congress (that makes it the most popular income stock owned by our representatives).
However, when dozens of millionaires with a history of beating average investors year after year own a particular stock, we think it's smart to pay attention.
Obviously, AT&T won't make you a millionaire overnight, but it is one of the most stable businesses in America. The shares fell with the broader market during the recession, but the underlying business kept steadily making money.
Today the company takes in about $127 billion in revenue each year and has about $4.5 billion in cashsitting in the bank. AT&T returns roughly $10 billion annually to investors in the form of dividends. And those payments have increased every year going all the way back to the 1980s.
I'm not necessarily recommending you snap up some shares of AT&T, but there is plenty to like about the stock... and importantly, Congress seems to agree.
While some investors will view AT&T as a "boring" old company past its prime, I view it as an established company that is worth owning for the long haul, complete with a 225-country-strong market position, billions of cash on hand and huge $20 billion annual cash flows that will help it acquire smaller competitors and keep growing its dividend for years.
It's traits like these that have rewarded long-term AT&T shareholders -- and Congress -- handsomely over the past decade. It's a major reason why AT&T has more than doubled the S&P 500's performance...
As the millionaire members of Congress may have already figured out, serious investors who ignore these long-term, market-beating traits are making a huge mistake. If you're not allocating some of your portfolio to strong companies like these and letting the returns compound year after year, you're missing one of the most important forces in the market. ...
Enhanced by Zemanta